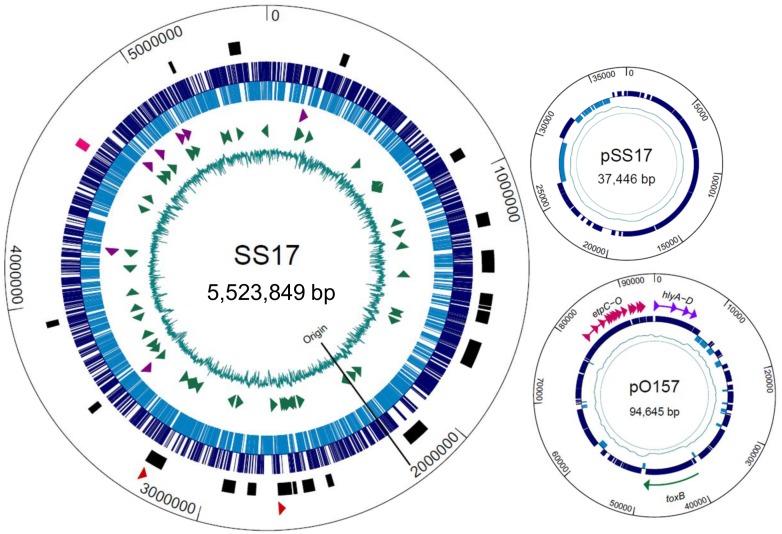
Figure 1. Genome map of SS17.
Larger circle depicts chromosomal DNA with the smaller circles representing the two plasmids. SS17: From inner circle: percent GC (teal); tRNA (green arrowheads); rRNA (purple arrowheads); ORFs (forward direction-dark blue, reverse-light blue); location of phage (black bars) and LEE operons (pink); Shiga toxin II genes (red arrowheads); pSS17: percent GC (teal); ORFs (blue); pO157: percent GC (teal); ORFs (blue); hemolysin genes (purple), toxB gene (green) and etp operon (pink).

