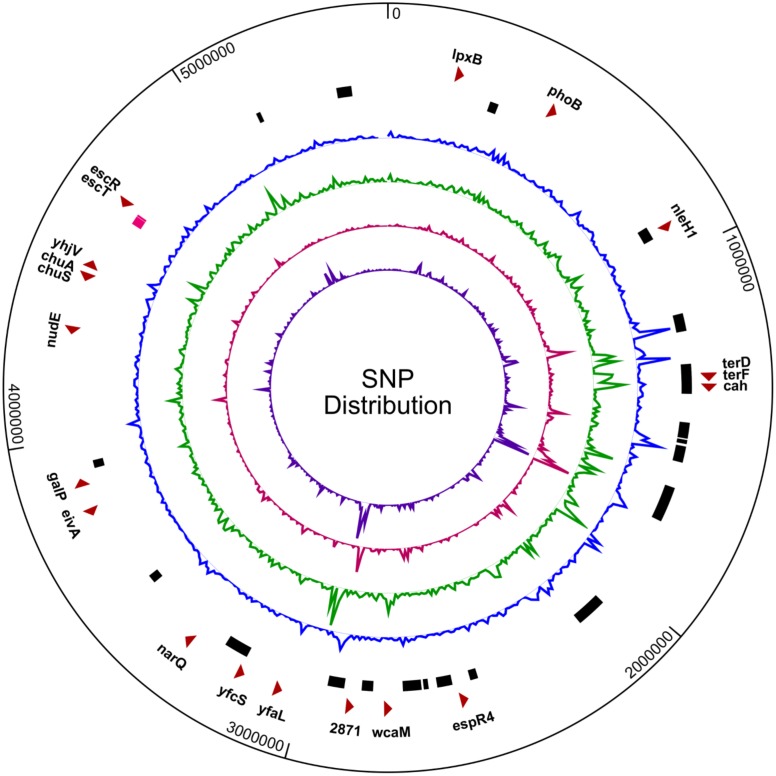
Figure 6. SNP distribution in the SS17 genome.
Distribution of single nucleotide polymorphisms (SNPs) in the SS17 genome shows a high density of SNPs clustered in phage regions. From outer ring: select genes with nsSNPs (red arrows), SS17 phage regions (black bars) with LEE operon (pink bar), SNP distribution when compared to Sakai (blue), EDL933 (green), TW14359 (red), and EC4115 (purple).

