
Figure 7.
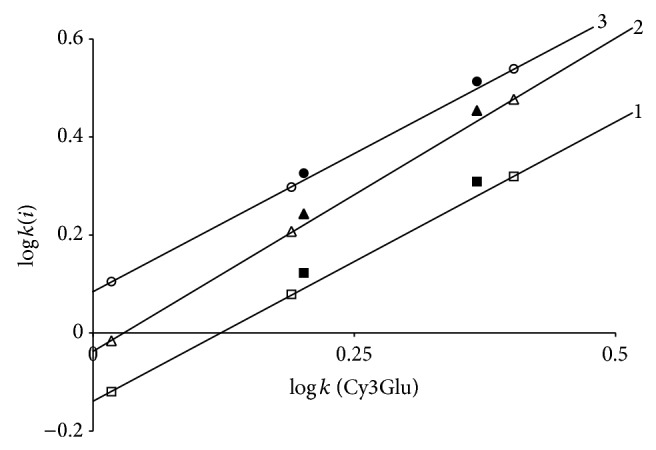
Comparison of separation maps for Cy3AGlu (1); Cy3XRut (2); and Cy3Rut (3) in System 1 (empty markers with lines) and in System 2 (corresponding black markers without lines).
Official websites use .gov
A
.gov website belongs to an official
government organization in the United States.
Secure .gov websites use HTTPS
A lock (
) or https:// means you've safely
connected to the .gov website. Share sensitive
information only on official, secure websites.
Comparison of separation maps for Cy3AGlu (1); Cy3XRut (2); and Cy3Rut (3) in System 1 (empty markers with lines) and in System 2 (corresponding black markers without lines).