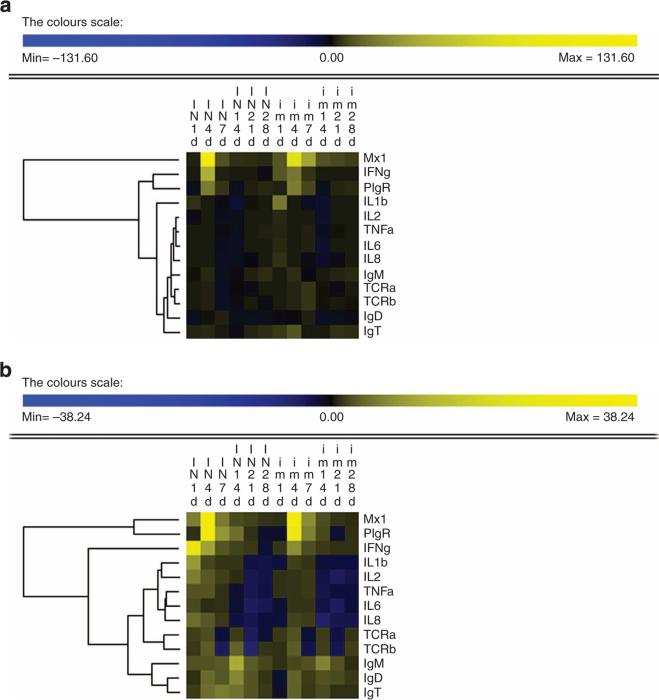
Figure 4. Kinetics of the immune response following nasal or injection vaccination.
Heat map illustrates results from quantitative real-time PCR of mRNAs for selected immune markers in IHNV-immunized fish versus control fish measured at 1, 4, 7, 14, 21 and 28 days post vaccination (N = 6) in the head-kidney (HK; a) and local immune response in the olfactory organ (b) of rainbow trout. Data are expressed as mean fold increase in expression±s.e. qPCR measurements were analysed by unpaired t-test, with P-values <0.05 considered significant.

