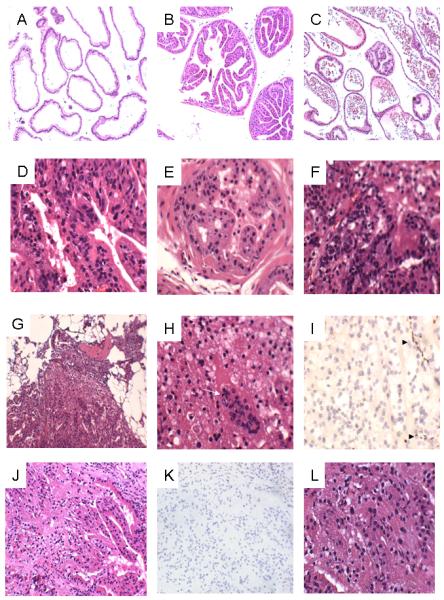
Figure 1.

Representative H&E and IHC images. A. Normal lateral glands (100x); B. Normal anterior prostate (100x); C. Ventral prostate (100x); D. Diffuse mPIN in ventral prostate (100x); E. mPIN in anterior prostate (400x) F. Diffuse mPIN in lateral prostate, elsewhere areas of invasive cancer are seen (400x); G to I. The first invasive cancer at low (100x, G), high (400x, H-note mitotic figure indicated by white arrow) magnification and IHC for p63 (400x, I). Note the presence of basal cells in adjacent mPIN areas but absence in tumor areas (I, solid arrowhead); J to L, The second invasive cancer at low (100x, J), IHC for p63 (100x, K) and high (400x, L) magnifications.
