Figure 4.
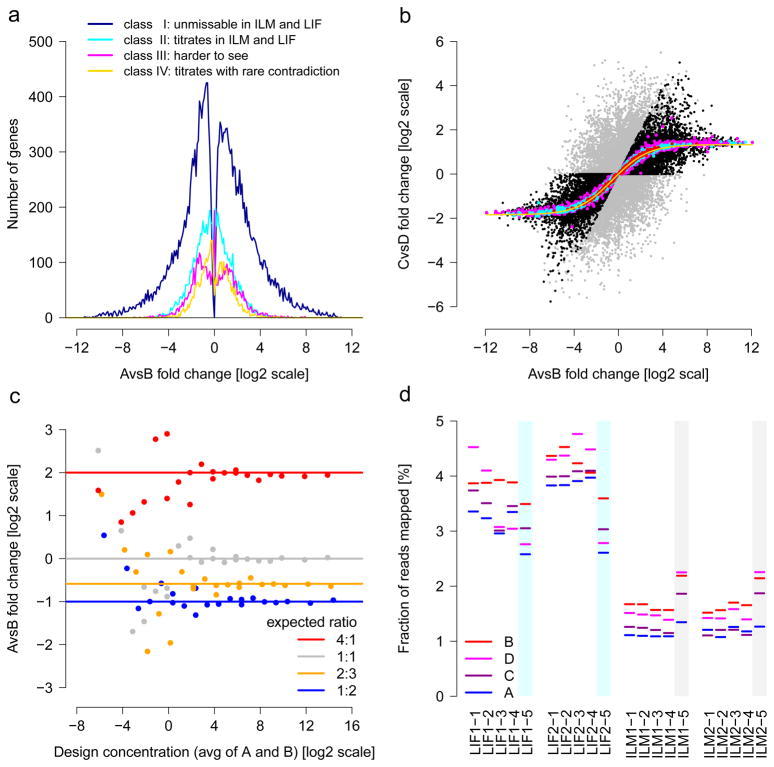
Built-in truths for assessing RNA-seq. (a) Titration order A, C, D, B. Log2 fold-change is related to cross-platform titration consistency. At sufficiently strong log2 fold-change, reliable titration is also found across platforms: The dark blue line represents the 22,074 ‘unmissable’ genes showing the correct titration order with no contradiction in at least 14 HiSeq 2000 and 6 SOLiD samples. Most genes with high differential expression are in this class. (b) Known A/B mixing ratios in samples C and D. The yellow solid line traces the expected values after mRNA/total-RNA shift correction. The 1%, 10% and 25% most highly expressed genes are shown in red, cyan and magenta, respectively. On average, the most strongly expressed genes recover the expected mixing ratio best. Genes with inconsistent titration (cf. a) are colored grey. Black and grey symbols intermixing indicates that consistent titration (black) does not guarantee reliable recovery of the mixing ratio (and vice versa). (c) ERCC spike-in ratios can be recovered increasingly well at higher expression levels. From the response curves, one can calculate signal thresholds for the detection of a change.50 (d) Variation of the total amounts of detected ERCC spikes. The lack of reliable titration indicates that the considerable differences between libraries of a given site and protocol are random, implying limits for absolute expression level estimates, in general, and using spike-ins for the calibration of absolute quantification, in particular. The observed variations likely arise in library construction, as the vendor-prepared libraries (colored cyan or grey) gave constant results across different sites. For (a) and (b), all 55,674 AceView genes tested.

