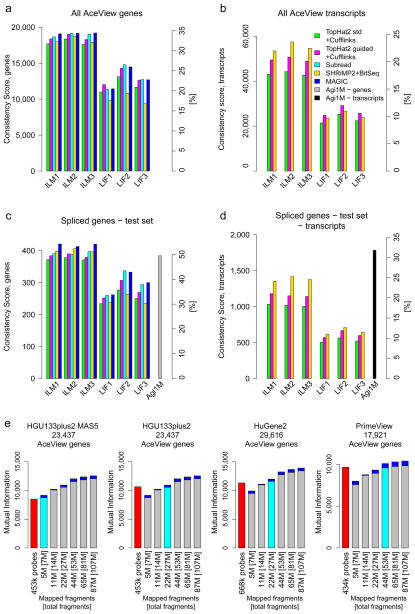
Figure 6.
Multiple performance metrics for the quantification of genes and alternative transcripts. The y-axes show a Consistency Score. Secondary y-axes mark the percentage of the maximal possible score. Panels show the three official HiSeq 2000 and SOLiD sites and compare a few analysis variants: Green, TopHat2; magenta, TopHat2 guided by known gene models; cyan, Subread; yellow, BitSeq; blue, Magic. Panels a and b consider all AceView annotated genes. Panels c and d focus on a subset of expressed complex genes with multiple alternative transcripts where comparison to a high-resolution test microarray (rightmost bar) can be conducted. (e) Comparison of RNA-seq to four different microarrays and data-processing methods (red bars) by plotting the mutual information (y-axes) at different read depths (x-axes). For the microarrays, the number of probes used is shown. The numbers given for RNA-seq state the number of fragments mapped to genes as well as the [total fragments]. SOLiD and HiSeq 2000 performed similarly well for comparable effective read depths (Supplementary Figure 33a). HiSeq 2000 data is plotted here. Each bar shows the minima and maxima across the three official sites. The read depth for which average RNA-seq performance met or exceeded that of the array is marked by a cyan bar. The corresponding read depths varied widely from 5 M (HGU133plus2 with MAS5) to about 50 M fragments (PrimeView with gcRMA/affyPLM), showing the strong effect of the reference gene set implied by the probes on the respective arrays and the employed microarray data-processing methods. Results are shown for the Subread pipeline. Alternative RNA-seq data analysis pipelines, however, can require up to double the number of fragments (TopHat2+Cufflinks, Supplementary Figure 35). See Supplementary Figures 33 and 34 for comparisons of other platforms and read depths.

