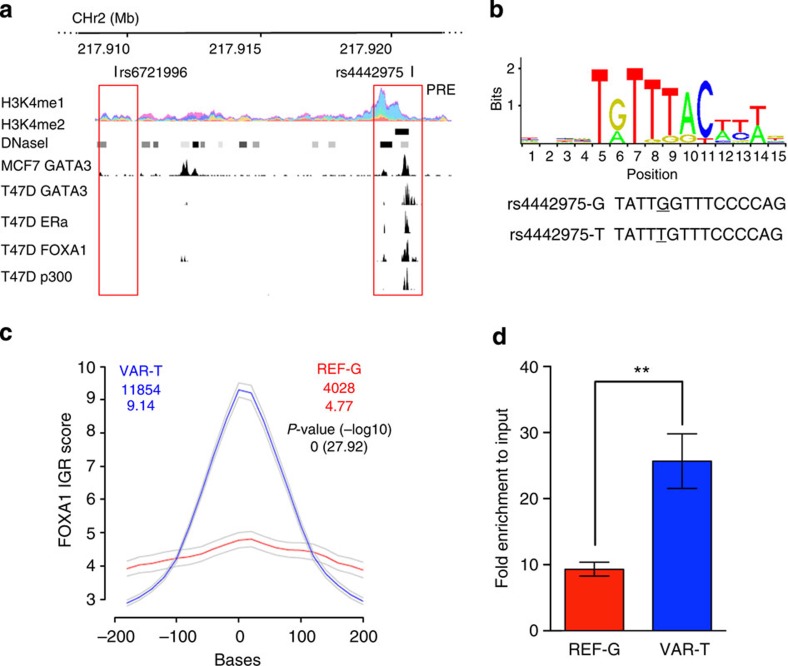
Figure 2. Allele-specific binding of FOXA1 at the rs4442975 site.
(a) Epigenetic and transcriptional landscape of the 2q35 risk interval. Coloured histogram denotes histone modification ChIP-seq data from ENCODE. Data from the UCSC Genome Browser, including epigenetic marks for H3K4me1 in seven cell types from ENCODE28, H3K4me2 from MCF7 cells4, DNaseI hypersensitivity clusters in 125 cell types from ENCODE28, and TF ChIP-seq data from MCF7 and T47D ER+ breast cancer cells, which are homozygous for the g-allele of rs4442975 and rs6721996 (ENCODE). The PRE contains SNP rs4442975. (b) Position weight matrix of FOXA1 from JASPAR, with homology to the risk (g) and cancer-protective (t) alleles of rs4442975 coloured below. (c) IGR histogram for SNP rs4442975 predicting the binding intensity of FOXA1 using a seven-nucleotide affinity model5. The top row of coloured numbers shows the number of instances for each K-mer found genome wide within H3K4me2 elements in MCF7 cells. The bottom row shows the averaged binding intensities at the K-mers (50 bp window). Control profiles, shown in grey, are generated by scrambling the probed sequence. (d) Allele-specific FOXA1 ChIP-qPCR results assessed at the rs4442975 SNP in heterozygous BT474 breast cancer cells. Error bars denote s.d. P values were determined with a two-tailed t-test. **P<0.01.

