
Figure 9. ASC KO T cells show reduced chlamydial-specific proliferation and IFNγ and IL-17 production.
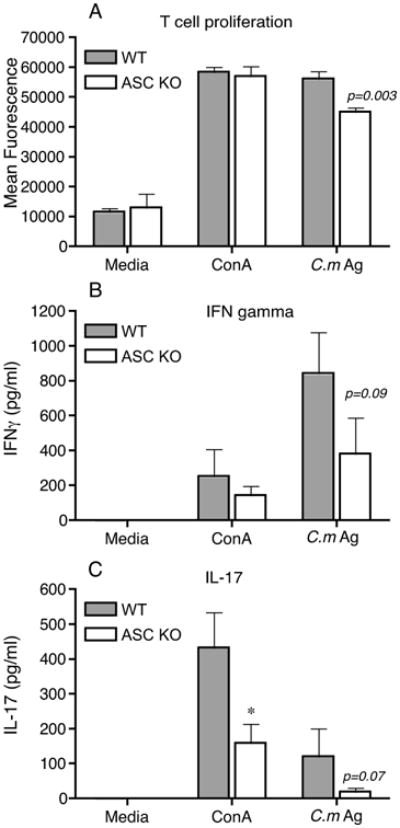
WT (N=4) and ASC KO (N=5) mice were infected with C. muridarum and iliac nodes harvested at day 14 postinfection. Cells were processed for C. muridarum-antigen (C.m Ag) - or mitogen (concanavalin A)-specific T cell proliferation (ConA) as described in Methods. After 4 days, alamarBlueTM was added and fluorescence measured after 24 h (A). Each sample was set in triplicate and data shows average for all mice in each group and SEM. Supernatants from T cell proliferation were analyzed for IFNγ at 1:10 dilution (B) or directly for IL-17 by ELISA (C). Significance measured using unpaired T test and * indicates p<0.05.