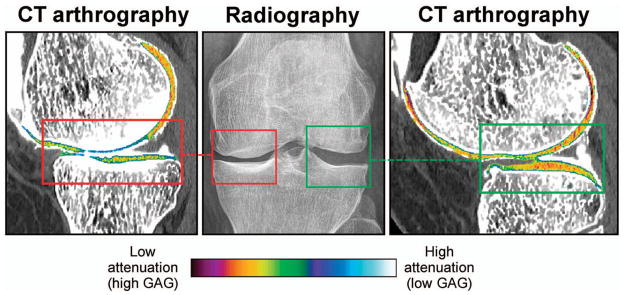
Figure 5.

Quantitative computed tomography (CT) arthrography detects Glycosaminoglycans (GAGs) reduction in osteoarthritis. Representative image of a knee with medial joint space narrowing (red box, middle panel) and a normal lateral joint space (green box, middle panel). CT arthrography clearly shows higher radiographic attenuation values, indicating less GAGs in the medial knee compartment (red box, left panel) compared to the lateral tibiofemoral compartment (green box, right panel) (34). Color figure can be viewed in the online issue, which is available at http://onlinelibrary.wiley.com/doi/10.1002/acr.22316/abstract.
