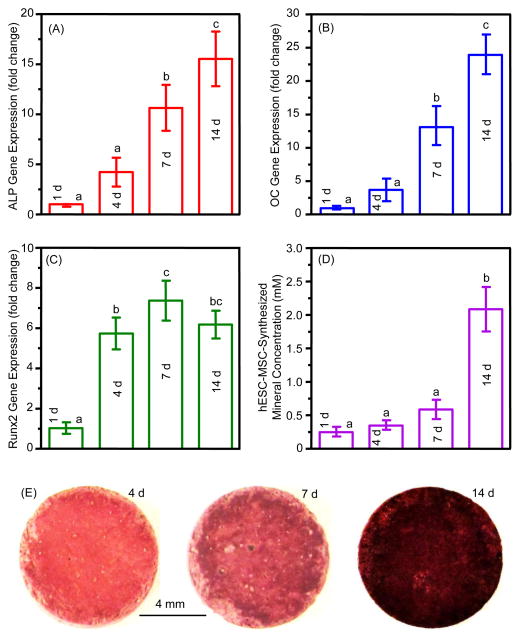
Figure 3.
Osteogenic differentiation of hESC-MSCs on CPC scaffolds (mean ± sd; n = 6). (A) Alkaline phosphatase (ALP) (F value = 34.145), (B) osteocalcin (OC) (F = 63.979), and (C) Runt-related transcription factor 2 (Runx2) gene expressions (F = 42.815). The Ct of hESC-MSCs cultured on CPC for 1 d served as the calibrator. (D) hESC-MSC-synthesized minerals (F = 58.727). (E) Representative photos of hESC-MSC-synthesized minerals stained red by ARS staining. Values with dissimilar letters are significantly different from each other (p < 0.05).

