
Table 2. Partial list of selective suppressors of superoxide/H2O2 production from site IQ, select structural analogs, and their effects on H2O2 production, ΔΨm and the rate of NAD(P)+ reduction from succinate via complex I.
Summary of effects on H2O2 production and ΔΨm of five compounds identified in the primary screen and ten structural analogs of one of these (CN-POBS). Dose-response curves between 0.08 and 80 µM were generated for each compound against the five sites of superoxide/H2O2 production (sites IQ, IF/DH, IIF, IIIQo and mGPDH) and ΔΨm assayed in the primary screen (data not shown; see Experimental procedures). IC50 values in the site IQ assay were estimated to determine relative potency against this site and relative selectivity in the other five assays. Estimated IC50 values were defined as the tested concentration, or the average of two tested concentrations (gray boxes), that yielded a normalized decrease of ~50% in site IQ superoxide/H2O2 production. The relative selectivity of inhibitors or analogs against the other assays was then compared at these defined IC50 values (or at 80 µM for compound 15). The five most potent and selective compounds were tested further for effects on the rate of NAD(P)+ reduction by succinate via complex I (rightmost column). LogP values are from the NCBI PubChem compound database. Values for all assays are the average of the normalized percent changes from DMSO for two duplicate runs, n.d., not determined.
| Compound | ChemBridge ID |
Structure | LogP | IC50(µM) | IQ | IF/DH | IIF | IIIQo | mGPDH | ΔΨm | Rate of NAD(P)+ Reduction |
|---|---|---|---|---|---|---|---|---|---|---|---|
| 1 | 5212116 | 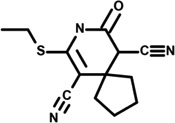 |
2.2 | 2.5 | −52 | −7 | 3 | 2 | 0 | −3 | n.d. |
| 2 | 5192566 | 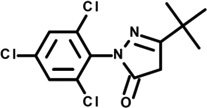 |
4.6 | 2.5 | −57 | 5 | −10 | −6 | 0 | −1 | n.d. |
| 3 | 5619111 | 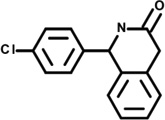 |
3.0 | 25 | −56 | −6 | −30 | −5 | −3 | −1 | n.d. |
| 4 | 5154627 | 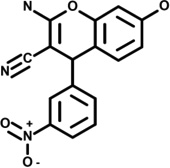 |
2.8 | 25 | −49 | 8 | −21 | 3 | −5 | −2 | n.d. |
| CN-POBS | 5229982 | 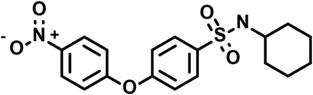 |
4.1 | 4.5 | −56 | 7 | 4 | 0 | −2 | −1 | −1 |
| 6 | 5918711 | 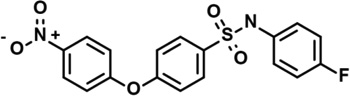 |
4.5 | 0.45 | −48 | −1 | 1 | 1 | 0 | −1 | −14 |
| 7 | 6669125 | 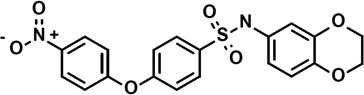 |
4.8 | 0.8 | −51 | 0 | 4 | −1 | −3 | −1 | −6 |
| 8 | 6491212 | 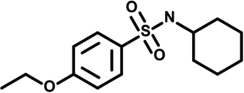 |
3.0 | 8 | −57 | 2 | −3 | 1 | 1 | −2 | 6 |
| 9 | 5315316 | 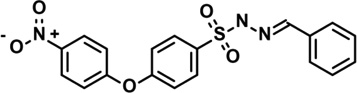 |
3.9 | 16 | −54 | −7 | −6 | 0 | −2 | −1 | n.d. |
| 10 | 5229983 | 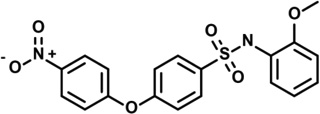 |
3.6 | 0.8 | −51 | 1 | −10 | 2 | 1 | 0 | 2 |
| 11 | 5229985 | 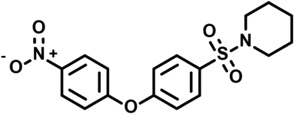 |
3.3 | 25 | −47 | 8 | −43 | −16 | −7 | 0 | n.d. |
| 12 | 5109687 | 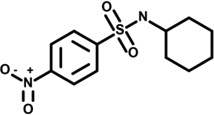 |
2.5 | 45 | −60 | −30 | −5 | 45 | 4 | −5 | n.d. |
| 13 | 9040813 | 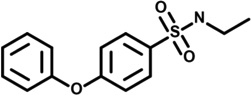 |
2.8 | 80 | −56 | 30 | −11 | 38 | 14 | −2 | n.d. |
| 14 | 7954145 | 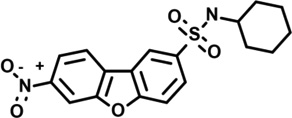 |
4.3 | −25 | −57 | −17 | 8 | 89 | 14 | −12 | n.d. |
| 15 | 7965586 | 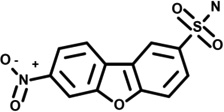 |
2.1 | »80 | −10 | 20 | −1 | 2 | 2 | 0 | n.d. |