
Figure 3.
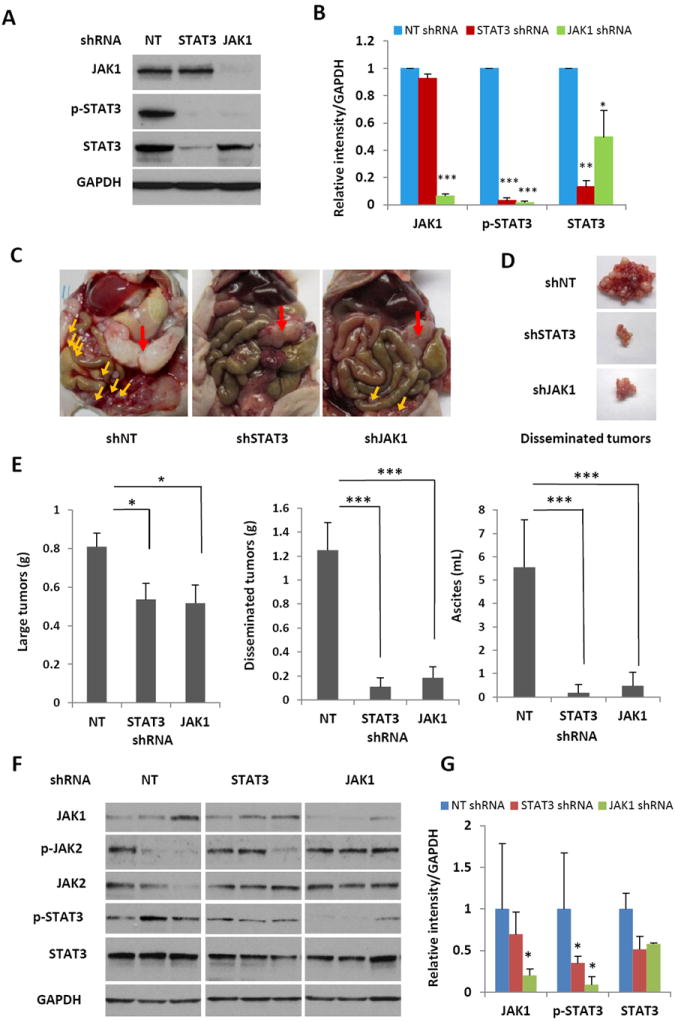
Knocking down JAK1 expression using RNA interference suppresses peritoneal dissemination and ascites formation in nude mice. (A) SKOV3-M-Luc cells were infected with shRNA against JAK1, STAT3 and control non-targeted shRNA (NT). The expression of JAK1, STAT3 as well as p-STAT3 was detected on Western blots. (B) Relative levels of p-STAT3, STAT3 and JAK1 were determined by measuring the density of each band and normalized to that of GAPDH. Densitometry data were relative changes in protein expression and were mean ± SD of 2-3 preparations. *, P<0.05, **, P<0.005, ***, P<0.0005, vs. shNT control. (C) Representative photographs of the peritoneal cavities of athymic nude mice 30 days after peritoneal inoculation of STAT3 active cells (shNT) or STAT3 inactive cells (shSTAT3 or shJAK1). Red arrow: large tumor; yellow arrows: small tumor nodules. (D) Representative photographs of disseminated peritoneal tumors. (E) Tumor burden and ascites production 30 days after tumor inoculation into the peritoneal cavity of athymic nude mice. Small tumor nodules, as well as the large primary tumor, were excised and weighed. Ascites was collected and the volume was measured. n=4-8, *, P<0.05, ***, P<0.0005, vs. shNT control. (F) Expression of STAT3 in xenograft tumors. Protein extracts were isolated from xenograft tumors and analyzed for the expression of p-STAT3, STAT3, p-JAK2, JAK2, and JAK1 on Western blots. (G) Relative level of JAK1, p-STAT3 and STAT3 were determined by measuring the density of each band and normalized to that of GAPDH. Densitometry data were relative changes in protein expression and were mean ± SD of 2-3 preparations. *, P<0.05, vs. shNT control.