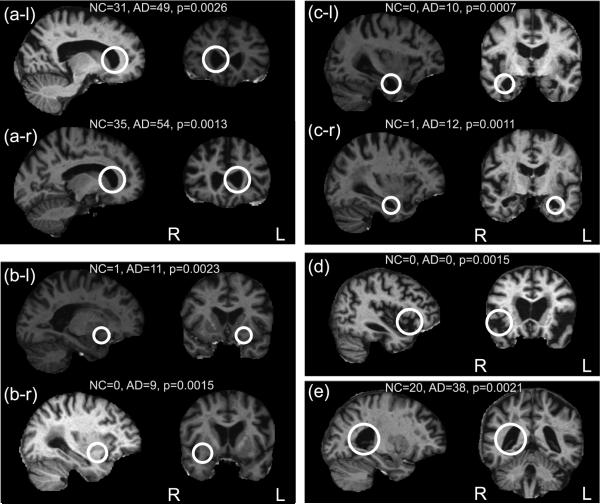
Figure 4.
Examples of the eight most significant AD-related features, shown in sagittal and coronal slices. The feature occurrence frequencies within 75 AD and 75 NC subjects and associated uncorrected p-values are given. Out of eight features, six represent similar anatomical regions identified independently in left and right hemispheres. All represent neuroanatomical regions known to be affected by AD.

