
Figure 2. APE-1 protein level is correlated with that of MiTF.
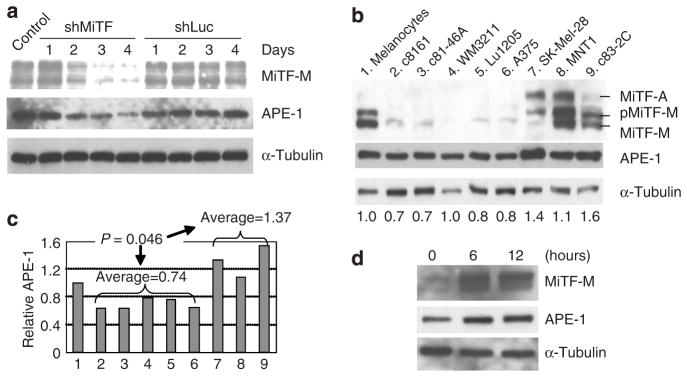
(a) Knockdown of MiTF led to a decrease in APE-1 protein accumulation. MNT1 cells were infected with Ad-shMiTF or Ad-shLuc and collected for western blot analysis at the indicated days. (b) Western blot analysis of MiTF and APE-1 accumulation in normal human melanocytes and melanoma cell lines: (1) Normal human melanocytes, (2) c8161, (3) c81-46A, (4) WM3211, (5) Lu1205, (6) A375, (7) SK-Mel-28, (8) MNT1, and (9) c83-2C. α-Tubulin serves as a loading control. Numbers below the western blot indicate the quantitated relative APE-1 levels (see c). (c) Quantitative analysis of APE-1 accumulation levels based on (b). The western results were quantitated by a densitometer and APE-1 level is normalized to α-tubulin. Normalized APE-1 accumulation in normal human melanocytes was defined as 1.0 and its levels in other cell lines were relative to normal human melanocytes. (d) APE-1 protein level is correlated to MiTF upregulation by α-MSH. Normal human melanocytes were cultured in media without 12-O-tetradecanoylphorbol-13-acetate and reduced bovine pituitary extract levels for 24 hours (lane 1), α-MSH was then added and cells were collected at 6 and 12 hours (lanes 2 and 3) for western blot analysis.