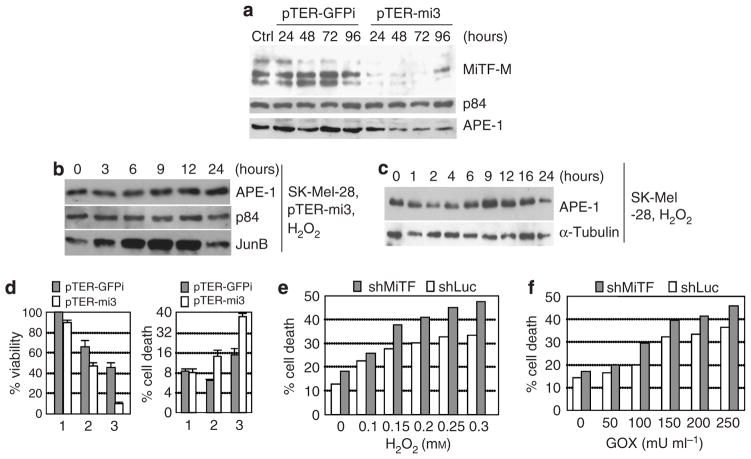
Figure 4. Knockdown of MiTF led to poor survival under ROS stress in melanoma cells.
(a) MiTF is knocked down by pTER-mi3 in SK-Mel-28 cells. SK-Mel-28 cells were transiently transfected by vector pTER-GFPi or pTER-mi3, cells were collected at the indicated time point for western blot analysis. p84 serves as loading control. Ctrl, cells without transfection. (b) Western blot analysis of APE-1 protein level in cells with depleted MiTF after 0.1mM H2O2 treatment. The pTER-mi3-transfected cells were treated with 0.1mM H2O2 24 hours after transfection, and collected for western blot analysis. Again p84 serves as loading control and JunB serves as a positive control. (c) Western blot analysis of APE-1 protein induction in SK-Mel-28 cells treated with 0.1mM H2O2. (d) Cell viability and cell-death analysis after MiTF knockdown. SK-Mel-28 cells were transfected with pTER-GFPi or pTER-mi3, 12 hours later cells were trypsinized and plated in 24-well plates. At 24 hours after transfection, 0 (lane 1), 0.1mM (lane 2), or 0.15mM (lane 3) of H2O2 was added into the media and continued to incubate for another 16 hours, when 3-(4,5-dimethylthiazol-2-yl)-2,5-diphenyltetrazolium bromide assay (left) or Trypan blue staining (right) was performed. (e, f) Cell death after H2O2 (e) or GOX (f) treatment in MNT1 infected with either adenovirus Ad-shLuc or Ad-shMiTF. Time 0 is 48 hours after infection, when treatment started. Cell death was analyzed 24 hours after treatment.

