Figure 1.
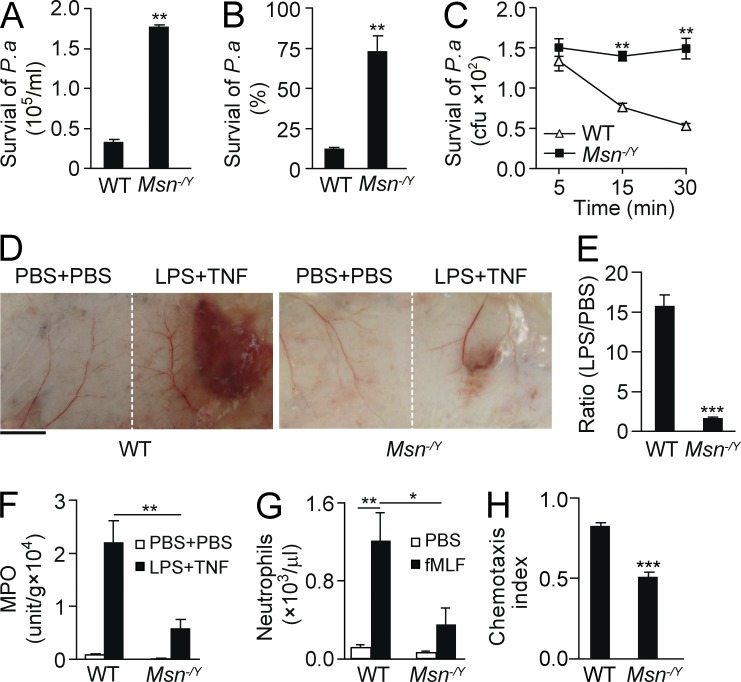
Moesin regulates neutrophil microbial killing and inflammation. (A and B) WT and moesin knockout (Msn−/Y) mice were i.t. injected with P. aeruginosa (2 × 10⁵). 8 h later, lungs were isolated, and the number (A) and percentage (B) of surviving colonies derived from lysates were determined. (C) WT and Msn−/Y neutrophils were incubated with opsonized P. aeruginosa for the indicated times, and surviving colonies were determined. (A–C) **, P < 0.01 compared with WT (Student’s t test). (D–F) Microvascular injury was induced in a classical LSR by consecutive injections of 80 µg LPS and then 0.2 µg TNF or PBS as controls. (D) Macroscopic appearance of dorsal skin in WT and Msn−/Y mice after LSR. Bar, 5 mm. (E) The degree of hemorrhage in the WT and Msn−/Y mice in D was estimated based on densitometry analysis of skin samples receiving either LPS or PBS injection. Results are shown as the ratio of the value with LPS versus the value with PBS. ***, P < 0.001 (Student’s t test). (F) Tissue MPO activities in skins were measured and normalized by tissue weight. Data are presented as V-Max value/g tissue. **, P < 0.01 (Student’s t test). (G) WT or Msn−/Y mice were i.p. injected with 10 nM fMLF, and neutrophil emigration into the peritoneal cavity was assessed after 4 h. For all groups, n = 3–4 mice. *, P < 0.05; **, P < 0.01 (Student’s t test). (H) WT and Msn−/Y neutrophils were exposed to a 10-nM fMIFL gradient, and CI was calculated by the ratio of net migration in the correct direction to the total migration length. ***, P < 0.001 compared with WT (Student’s t test). Data are representative of (D) or are compiled from (A–C and E–H) three independent experiments (mean and SEM in A–C and E–H).

