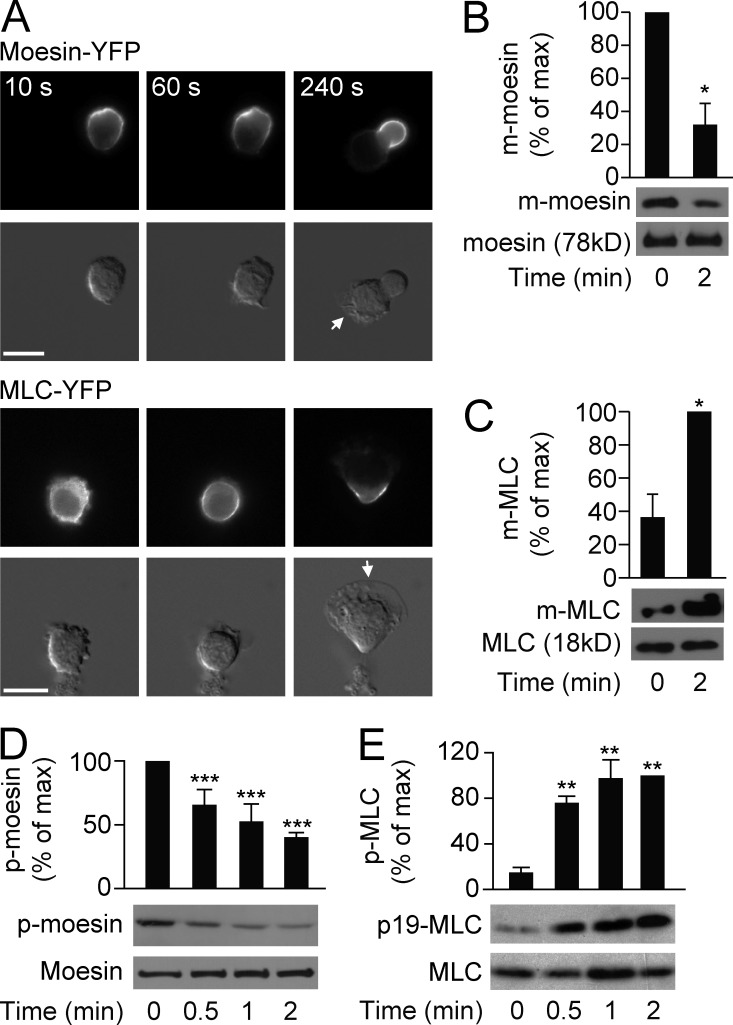
Figure 2.
Differential activation of moesin and MLC. (A) HL60 cells (n > 30 per group) expressing moesin-YFP or MLC-YFP were stimulated for the indicated times with 100 nM fMLF and visualized by fluorescence (top rows) and differential interference contrast (DIC) microscopy (bottom rows). Arrows indicate leading edges. Bars, 10 µm. (B and C) HL60 cells were left untreated or were stimulated with 100 nM fMLF, and quantification of membrane-bound (m-) moesin (B) or m-MLC (C) was evaluated by immunoblot. Levels were quantitated and presented relative to the maximum value. *, P < 0.05 compared with the value at basal (Student’s t test). (D and E) HL60 cells were stimulated for the indicated times with 100 nM fMLF, and phosphorylated (p-) moesin (D) or p-MLC (E) versus total protein levels were assessed by immunoblot. Graph shows quantification of p-moesin and p-MLC, presented relative to maximum activation of p-moesin at 0 min or p-MLC at 2 min. **, P < 0.01; ***, P < 0.001 compared with the value at 0 min (Student’s t test). Data are representative of (A and blots in B–E) or are compiled from three independent experiments (graphs in B–E; mean and SEM in B–E).

