Figure 3.
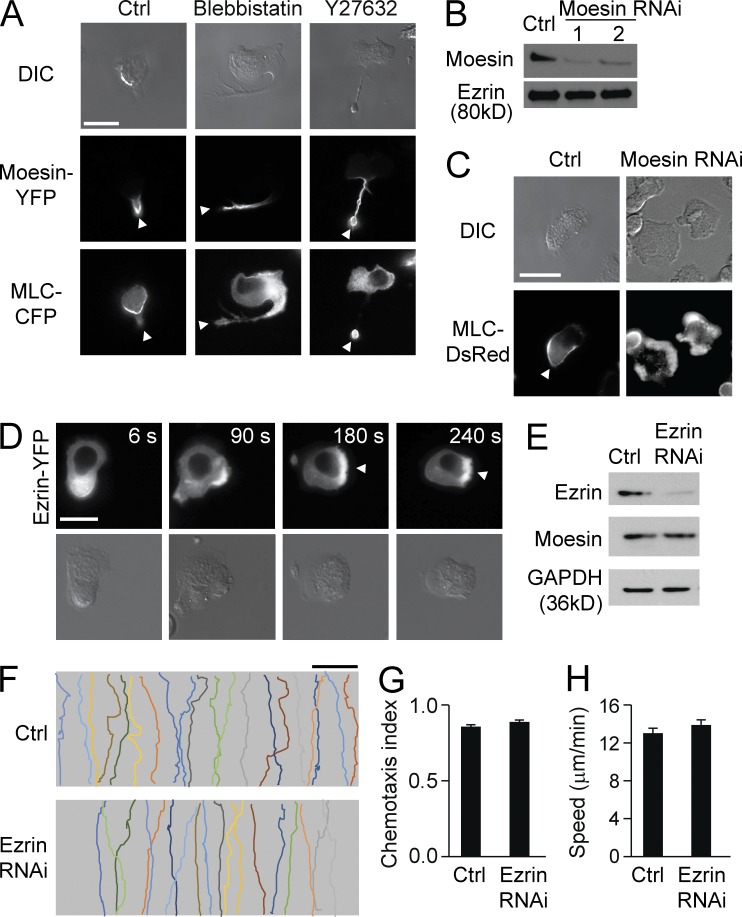
Moesin regulates MLC localization. (A) HL60 cells expressing both moesin-YFP and MLC-CFP were left untreated (left) or were treated with blebbistatin (middle) or Y27632 (right) in the presence of 100 nM fMLF for 2 min. Cells were visualized by DIC (top) and fluorescence microscopy (middle and bottom). (B) Expression of moesin in control cells and moesin RNAi–treated cells was analyzed by immunoblot. Two moesin RNAi–treated cell lines are shown. Ezrin was used as a loading control. (C) Control and moesin RNAi–treated cells expressing MLC-DsRed were stimulated with 100 nM fMLF for 2 min, and cells were visualized by DIC (top) and fluorescence microscopy (bottom). (A and C) Arrowheads indicate the trailing edges. (D) Cells expressing ezrin-YFP were stimulated with 100 nM fMLF and imaged by fluorescence (top) and DIC microscopy (bottom) at the indicated times. Arrowheads point to the leading edges. (E) Expression of ezrin was assessed in control and ezrin RNAi–treated cells by immunoblot. Moesin and GAPDH were used as loading controls. (F) HL60 cells were left untreated (Ctrl) or were treated with ezrin RNAi in an fMLF gradient of 100 nM (>30 cells per condition). Each trace represents the trajectory of one cell. Bars: (A, C, and D) 10 µm; (F) 100 µm. (G and H) Cells were treated as in F, and CI (G) and migration speed (H) were calculated. Data are representative of (A–F) or are compiled from three independent experiments (G and H; mean and SEM in G and H).

