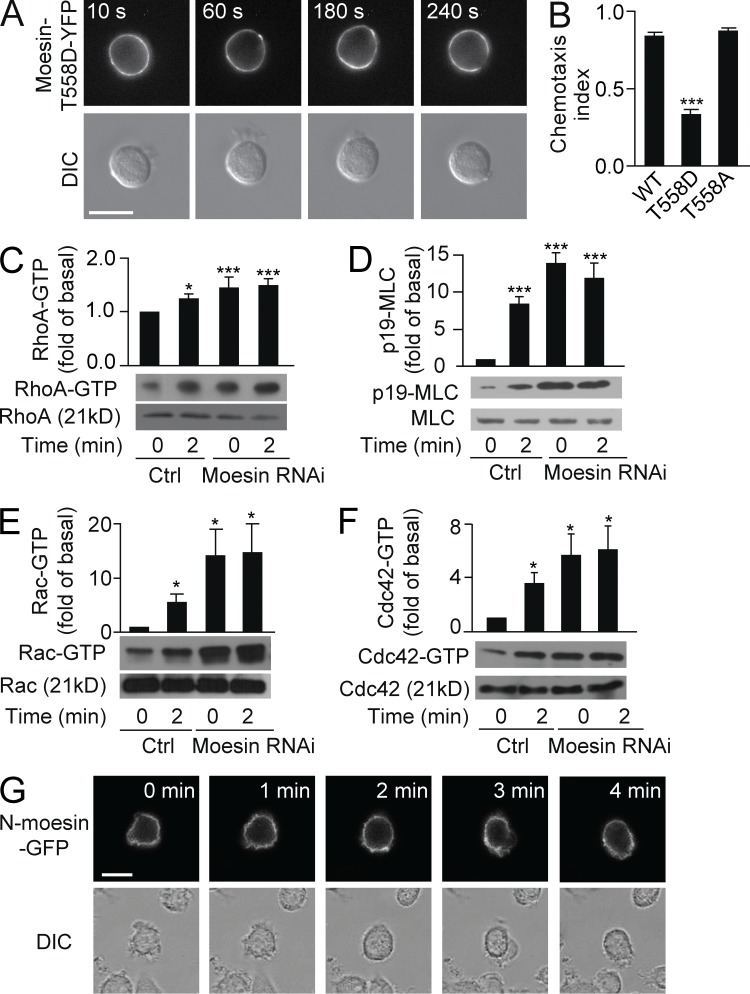
Figure 5.
Moesin inhibits Rho, Rac, and Cdc42 activity. (A) HL60 cells (n > 30) expressing moesin-T558D-YFP were stimulated for the indicated times with 100 nM fMLF and visualized by fluorescence (top) and DIC microscopy (bottom). (B) HL60 cells expressing WT-moesin, moesin-T558D, or moesin-T558A were exposed to an fMLF gradient of 100 nM (>30 cells per condition), and CI was calculated. ***, P < 0.001 compared with WT (Student’s t test). (C–F) Control and moesin RNAi cells were stimulated with 100 nM fMLF for 0 or 2 min. Expression of RhoA-GTP and total RhoA (C), p-MLC and total MLC (D), Rac-GTP and total Rac (E), and Cdc42-GTP and total Cdc42 (F) was measured by immunoblot. Graphs show quantification of immunoblot data. Results are shown relative to control cells at 0 min. *, P < 0.05; ***, P < 0.001 compared with control (Student’s t test). (G) HL60 cells (n > 30 per group) expressing N-moesin–GFP were stimulated for the indicated times with 100 nM fMLF and visualized using fluorescence (top) and DIC microscopy (bottom). (A and G) Bars, 10 µm. Data are representative of (A and G and blots in C–F) or are compiled from three independent experiments (B and graphs in C–F; mean and SEM in B–F).

