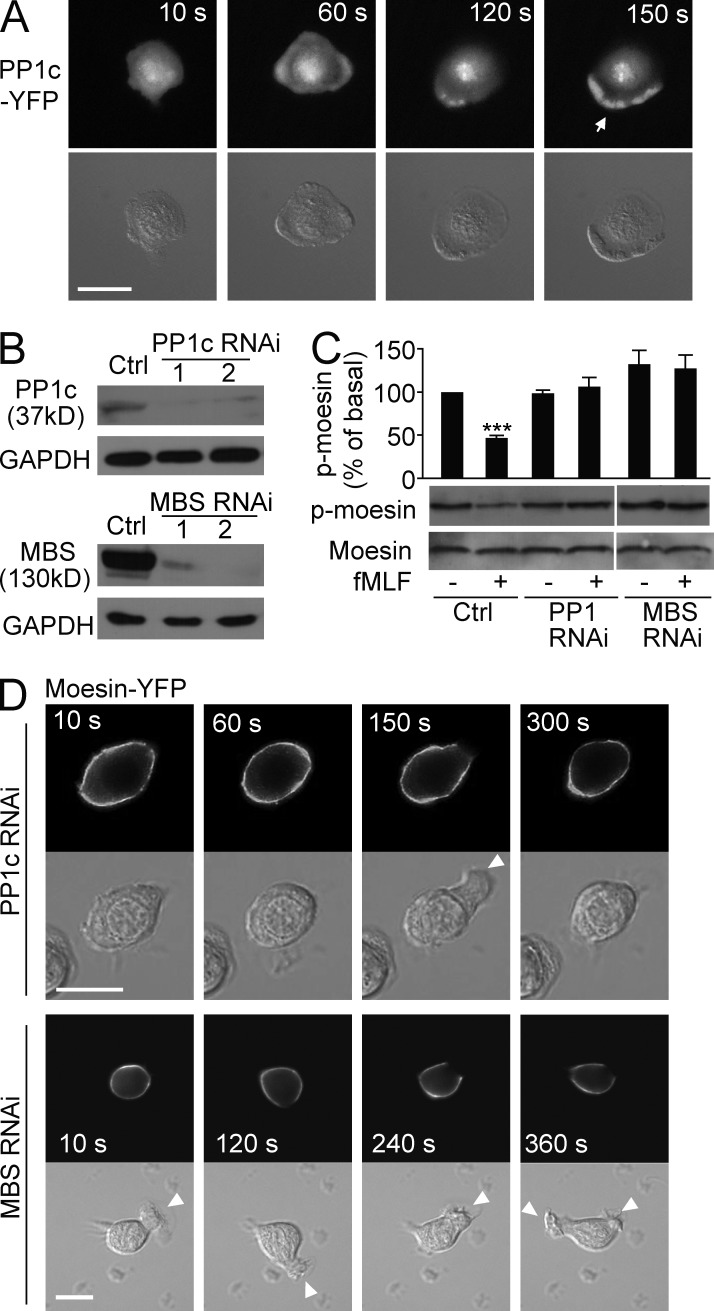
Figure 8.
Myosin phosphatase releases moesin-mediated inhibition. (A) HL60 cells (n > 30) expressing PP1c-YFP were stimulated for the indicated times with 100 nM fMLF and were visualized with fluorescence (top) and DIC microscopy (bottom). Arrow indicates the leading edge. (B) Expression of PP1c (top) or MBS (bottom) in control and PP1c RNAi cells or in control and MBS RNAi cells was measured by immunoblot. Two PP1c or MBS RNAi cell lines are shown. GAPDH was used as a loading control. (C) Control, PP1c, or MBS RNAi cells were stimulated with 100 nM fMLF. Expression of p-moesin and total moesin was measured with immunoblot. Graph shows quantification of immunoblot data. Results are presented relative to maximum activation of p-moesin at 0 min. ***, P < 0.001 compared with control without fMLF. (D) PP1c RNAi cells or MBS RNAi cells (n > 30 per group) expressing moesin-YFP were stimulated for the indicated times with 100 nM fMLF and were visualized with fluorescence (top) and DIC microscopy (bottom). Arrowheads indicate transient leading edges. (A and D) Bars, 10 µm. Data are representative of (A, B, D, and blots in C) or are compiled from three independent experiments (graph in C; mean and SEM in C).

