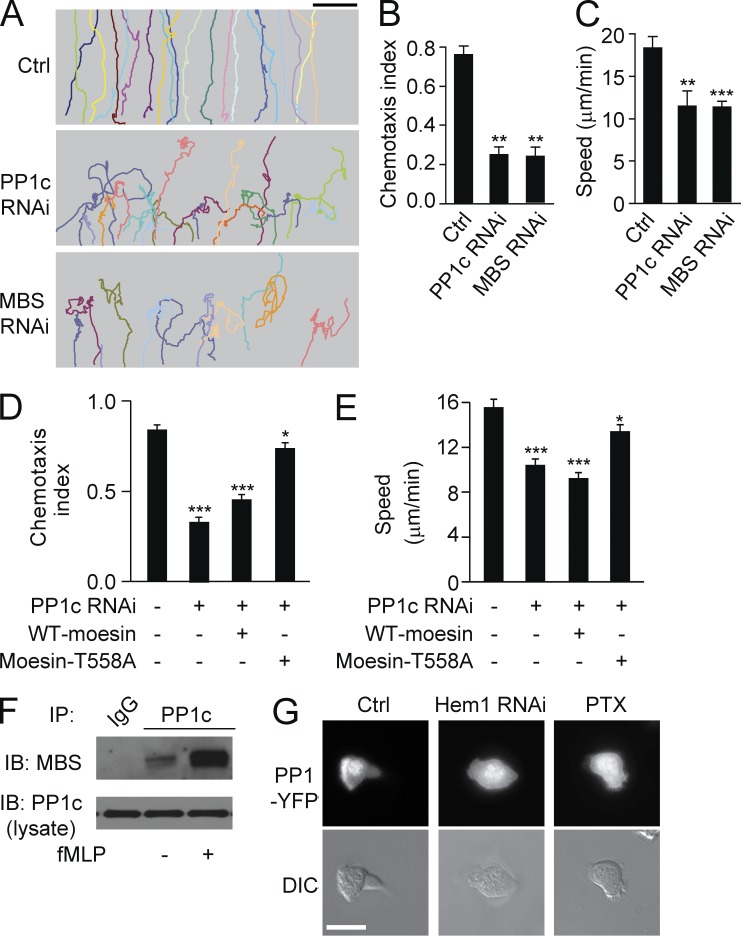
Figure 9.
Myosin phosphatase is recruited to the leading edges by front signals. (A) Control, PP1c RNAi, or MBS RNAi cells were exposed to an fMLF gradient of 100 nM (>30 cells per condition). Each trace represents the trajectory of one cell. (B and C) Cells were treated as in A. CI (B) and migration speed (C) were calculated. **, P < 0.01; ***, P < 0.001 compared with control (Student’s t test). (D and E) Control, PP1c RNAi, PP1c RNAi + WT-moesin, and PP1c RNAi + mosein-T558A cells were exposed to an fMLF gradient. CI (D) and migration speed (E) were calculated. *, P < 0.01; ***, P < 0.001 compared with control (Student’s t test). (F) PP1c was pulled down with MBS in the presence or absence of fMLF in HL60 cells. (G) HL60 cells (n > 30 per group) expressing PP1c-YFP were left untreated (left) or treated with Hem1 RNAi (middle) or PTX (right) in the presence of 100 nM fMLF for 2 min. Cells were visualized with fluorescence (top) and DIC microscopy (bottom). Bars: (A) 100 µm; (G) 10 µm. Data are representative of (A, F, and G) or are compiled from three independent experiments (B–E; mean and SEM in B–E).

