Figure 1.
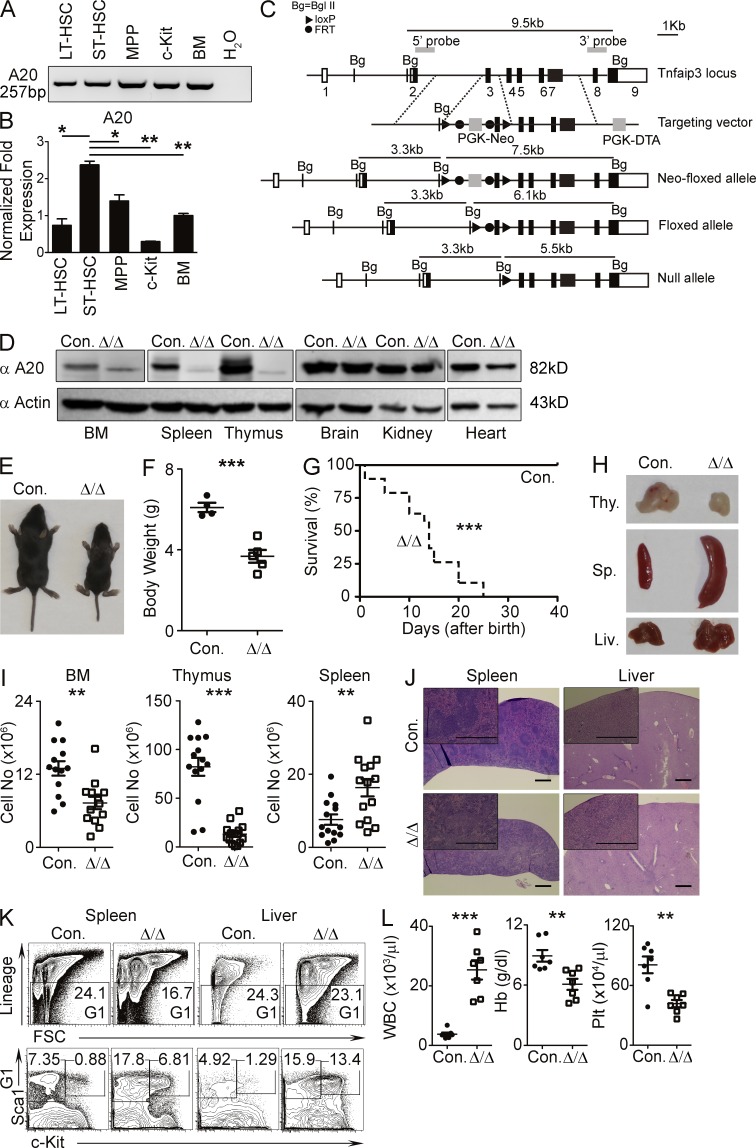
A20 deficiency leads to pathological hematopoiesis. (A and B) Reverse transcription–PCR (A) and real-time PCR (B) analyses showing A20 mRNA expression in the indicated hematopoietic subsets of WT BM. Expression levels of A20 were normalized to Hprt levels. (C) Scheme representing the Tnfaip3 gene targeting strategy. (D) Western blot analysis of A20 protein in cells from the indicated organs of A20Hem-KO and WT control mice. (E) Representative images of control and A20Hem-KO mice showing body size. (F) Total body weight of control (n = 4) and A20Hem-KO (n = 5) mice at 14 d of birth. (G) Kaplan-Meier survival curve analysis of A20Hem-KO (n = 15) and control (n = 15) mice. Significance (***, P < 0.001) was assessed using the log-rank test. (H) Representative images of thymus, spleen, and liver of 14-d-old A20Hem-KO and control mice. (I) Cellularity of BM (two femurs and two tibias), thymus, and spleen of 14-d-old A20Hem-KO (n = 13–14) and control (n = 13–14) mice. Data are representative of 10 independent experiments. (J) Representative hematoxylin and eosin images (bars, 0.5 mm) of spleen and liver of 14-d-old A20Hem-KO and control mice. In each panel, a high-magnification image is shown at the top left corner. (A, B, D, and J) Data are representative of two independent experiments. (K) FACS plots of LSK and Lin−c-Kit+Sca1− cells in the spleen and liver of 14-d-old A20Hem-KO and control mice. Data are representative of three independent experiments. (L) Differential blood count analysis of 14-d-old A20Hem-KO (n = 7) and control (n = 7) mice. Data are pooled from seven independent experiments. All data represent mean ± SEM. Two-tailed Student’s t tests were used to assess statistical significance (*, P < 0.05; **, P < 0.01; ***, P < 0.001).

