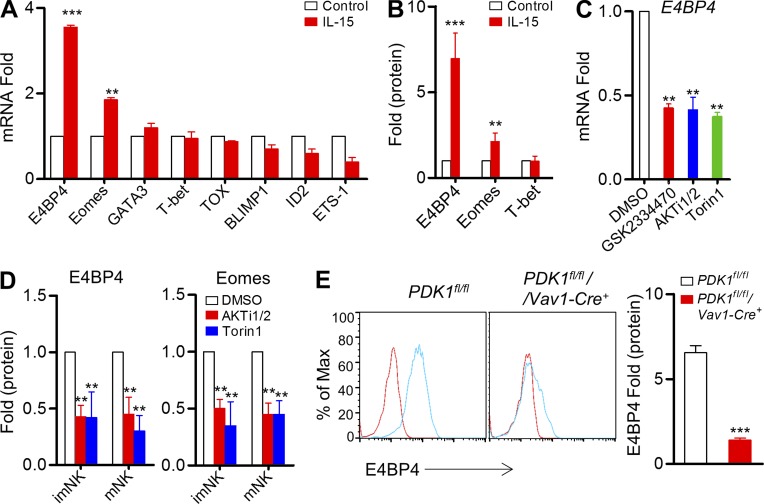
Figure 1.
PDK1-mTOR signaling regulates IL-15–induced E4BP4 expression in vitro. (A) Quantitative RT-PCR analysis of NK cell–related genes in sorted wild-type CD3−NK1.1+ cells before and after stimulation with IL-15–IL-15R complexes; the results were normalized to those of β-actin and are presented relative to those of untreated cells, set as 1. Data were pooled from three independent experiments. **, P < 0.005; ***, P < 0.0005 versus control. (B) Intracellular staining was used to analyze the expression of E4BP4, Eomes, and T-bet on gated CD3−NK1.1+ cells by flow cytometry before and after stimulation with IL-15–IL-15R complexes; the results were normalized and are presented relative to MFI of untreated cells, set as 1. Data were pooled from four independent experiments. **, P < 0.005; ***, P < 0.0005 versus control. (C) Quantitative RT-PCR analysis of E4bp4 in sorted wild-type CD3−NK1.1+ cells after stimulation with IL-15–IL-15R complexes in the presence of the indicated inhibitors or of DMSO (control); the results were normalized to those of β-actin and are presented relative to those of DMSO-treated cells, set as 1. Data represent the mean ± SEM (3 repeats). **, P < 0.005 versus DMSO. (D) Intracellular staining was used to analyze the expression of E4BP4 and Eomes on gated CD3−NK1.1+ cells by flow cytometry after stimulation with IL-15–IL-15R complexes plus indicated inhibitors; the results were normalized and are presented relative to those of DMSO-treated cells, set as 1. Data represent the mean ± SEM (3 repeats). **, P < 0.005 versus DMSO. (E) Intracellular staining was used to analyze the expression of E4BP4 in CD3−CD122high NK1.1+ NK cells by flow cytometry from indicated mice before and after stimulated with IL-15–IL-15R complexes. Representative overlaid histogram is shown (left). Red lines, unstimulated; Blue lines, stimulated. Results are presented relative to MFI values before treatment. Data were pooled from two independent experiments (right, n = 4). ***, P < 0.0005.

