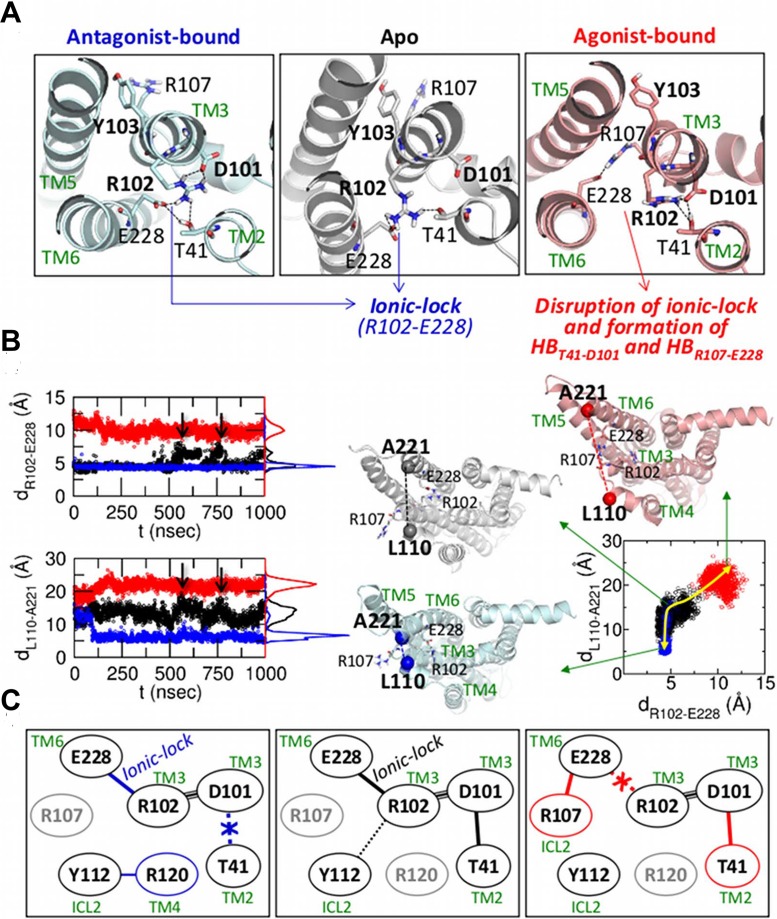
Figure 2.
 3 and
3 and  4 defined in the DRY motif and ionic-lock.
(a) Configurations of the DRY motif and ionic-lock in the three receptor states. (b) The distances of R102Cζ-E228Cδ (left, top) and L110Cα-A221Cα (left, bottom) are colored in black, blue, and red for the apo, antagonist-bound, and agonist-bound states, respectively, and their histograms are shown on the right side of the plots. On the right panel, scattered plot using the distances of R102-E228 and L110-A221 is shown with the yellow arrow depicting the conformational transition between three ligand forms. (c) Diagram of the H-bond network in the three receptor states.

