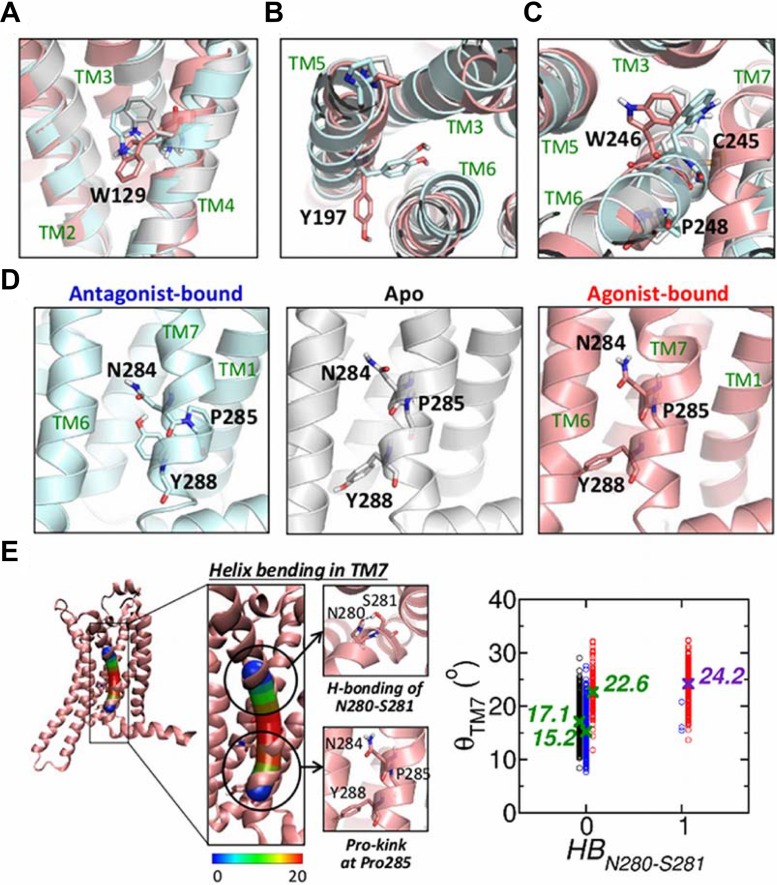
Figure 3.
 5 to
5 to  10 defined from the rotameric switches in TM4, TM5, TM6, and TM7.
Rotameric states of (a) W129, (b) Y197, (c) CWxP motif, and (d) NPxxY motif are compared for the apo (white), antagonist-bound (cyan), and agonist-bound (pink) forms. (e) Helix bending in TM7. The helix bending angle (bendix) of TM7 was calculated using bendix program [45]. The helix is displayed as a cylinder marked with the heatmap ranging from 0o to 20o. The scatter plot on right side depicts the relationship between H-bond of N280-S281 and the bending angle of the TM7 helix (apo: black, antagonist-bound: blue, agonist-bound states: red). The average bending angles are annotated with the symbols, X.

