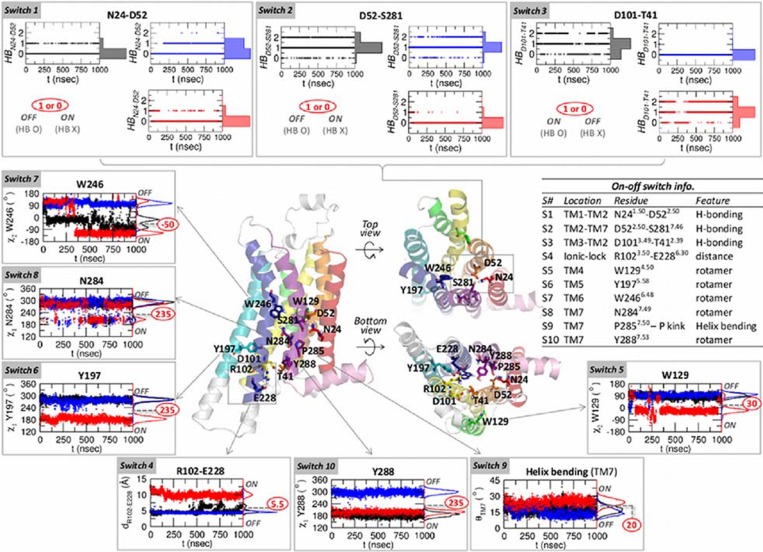
Figure 4. Ten binary switches.
The time traces of the apo, antagonist-bound, and agonist-bound forms are colored by black, blue, and red, respectively, and their histograms are shown on the right side of the panels. From  4 to
4 to  10, the values separating the on and off states are marked in red circles.

