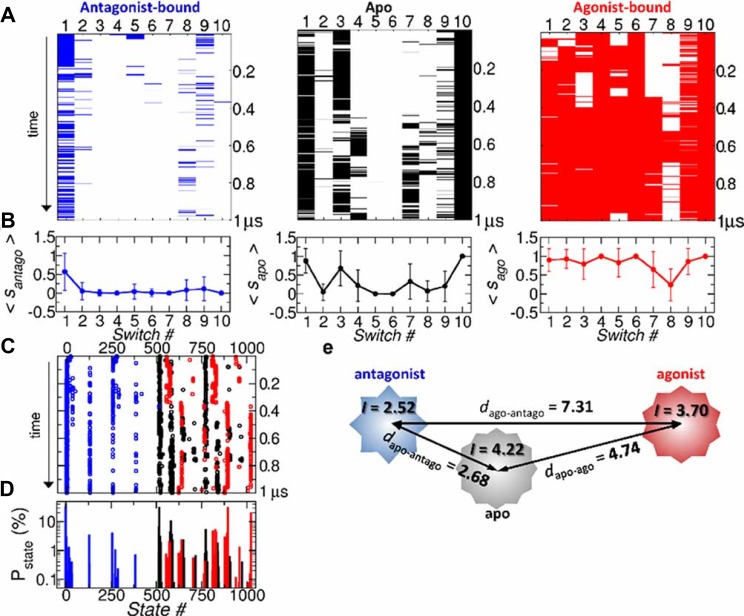
Figure 5. Dynamics of A2AAR in 10-binary switch representation.
(a) Simulation trajectories of antagonist (blue), apo (black), agonist (red) form represented in terms of the ON/OFF state of 10 switches. The lines denote the ON states, and the trajectories evolve from the top to bottom. (b) Mean value of each switch with error bar denoting the standard deviation. (c) Time traces of the microstates represented by the decimal numbers from 0 to 1023 in the apo (black), antagonist-bound (blue), and agonist-bound (red) forms. (d) Corresponding population of the microstates. (e) A schematic of similarity between three receptor states in terms of Hamming distance d αβ with the measure of complexity, I (Eq. 2), illustrated with polygons.

