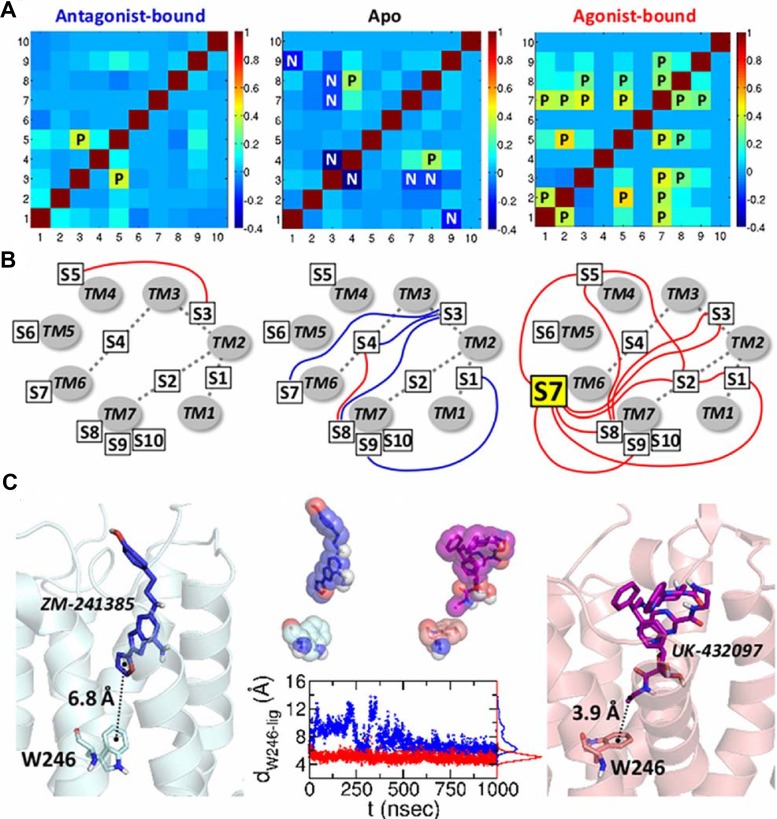
Figure 7. Cross-correlations among binary switches.
(a) Cross-correlation matrices between the changes in 10 ON/OFF switches for three distinct receptor states calculated by using Fig. 3. The symbols “P” in the matrix elements are for the postive correlatin (C
ij > 0.25); “N” is for the negative correlation (C
ij < −0.25). (b) Diagram of the cross-correlation between the switches. TM1 to TM7 helices are displayed in gray circles, and the ten switches are specified with the boxes. The positive and negative correlations are depicted using red and blue lines, respectively. (c) Coordination of the antagonist and agonist to  7 (W246). W246 and the bound ligands are depicted in the left and right figures. The graph in the middle shows the distances between the center of mass of the W246 (indole 6-ring) and the center of mass of the furan ring (ZM-241385, blue) and ethyl group (UK-432097, red).

