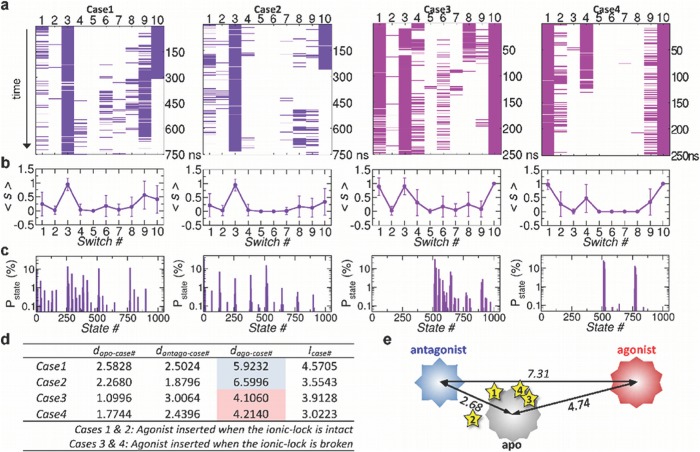
Figure 8. Agonist inserted to apo form.
(a) Time traces from the case 1 to case 4. In the cases 1 and 2, the agonist was inserted into the apo form when the ionic-lock was intact; whereas in the cases 3 and 4, the agonist was inserted when the ionic-lock was disrupted. (b) Average values of switch from  1 to
1 to  10 for the case 1 through 4. (c) Population of microstates sampled after the insertion of agonist. (d) Hamming distance and complexity calculated for cases 1–4. (e) The stars are the locations of the cases from 1 to 4, calculated in terms of Hamming distance relative to the apo, antagonist, and agonist forms.

