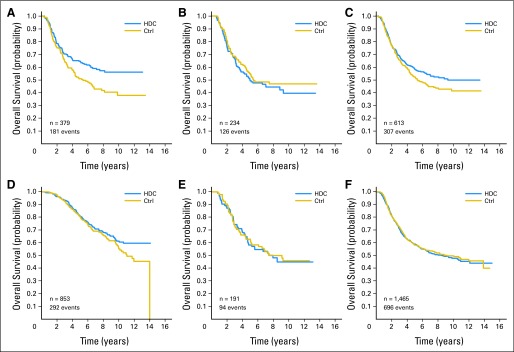
Fig 5.

Kaplan-Meier estimates of overall survival comparison of high-dose chemotherapy (HDC) and control (Ctrl) therapy in subsets of patients defined by hormone receptor (HmR) status and human epidermal growth factor receptor 2 (HER2) status. (A) HmR negative, HER2 negative; (B) HmR negative, HER2 positive, (C) HmR negative, HER2 either positive or negative (known); (D) HmR positive, HER2 negative; (E) HmR positive, HER2 positive; (F) HmR negative, HER2 unknown.
