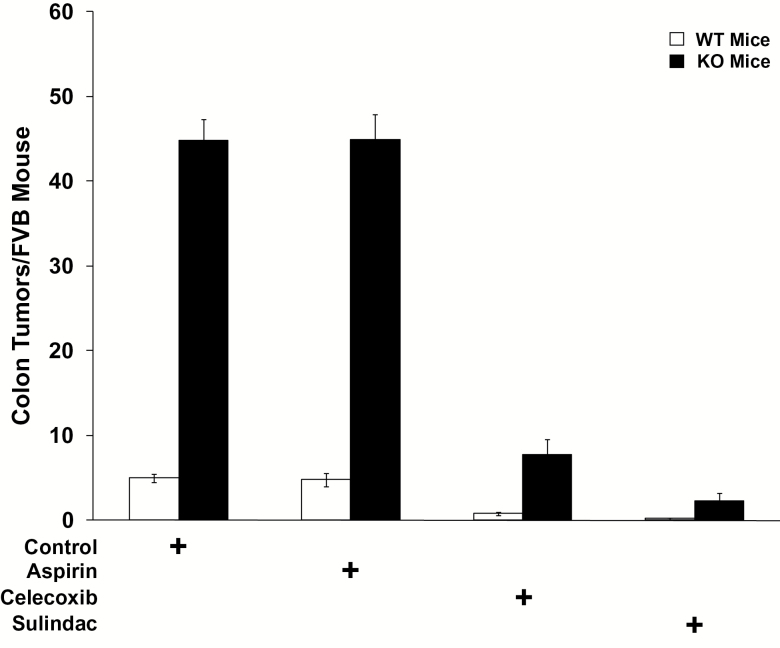
Figure 3.
AOM induced colon tumor development in 15-PGDH WT FVB mice (open bars) that are: untreated (control, n = 19) or treated with celecoxib (n = 16), aspirin (n = 17) or sulindac (n = 19); versus FVB 15-PGDH KO mice (black bars) that are: untreated (control, n = 19), or treated with celecoxib (n = 20), aspirin (n = 16) or sulindac (n = 18). Error bars designate standard error of the mean.

