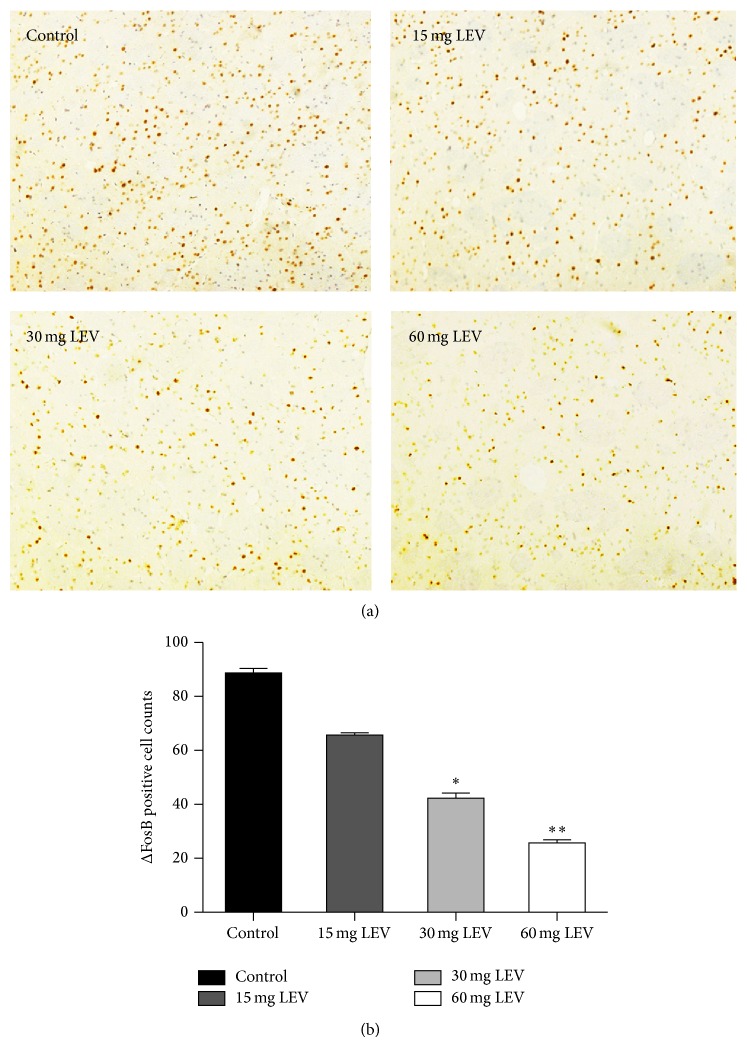
Figure 2.
Levetiracetam-induced changes in FosB/ΔFosB immunostaining of the dorsolateral portion of the striatum. (a) Images of striatal slices from the lesion side of an animal from each treatment group (control, 15, 30, and 60 mg/kg levetiracetam denoted as LEV; ×200). (b) Immunoreactive cell count in each treatment group. Values are mean ± SEM. * P < 0.05 and ** P < 0.01 versus control group (n = 4 per group).

