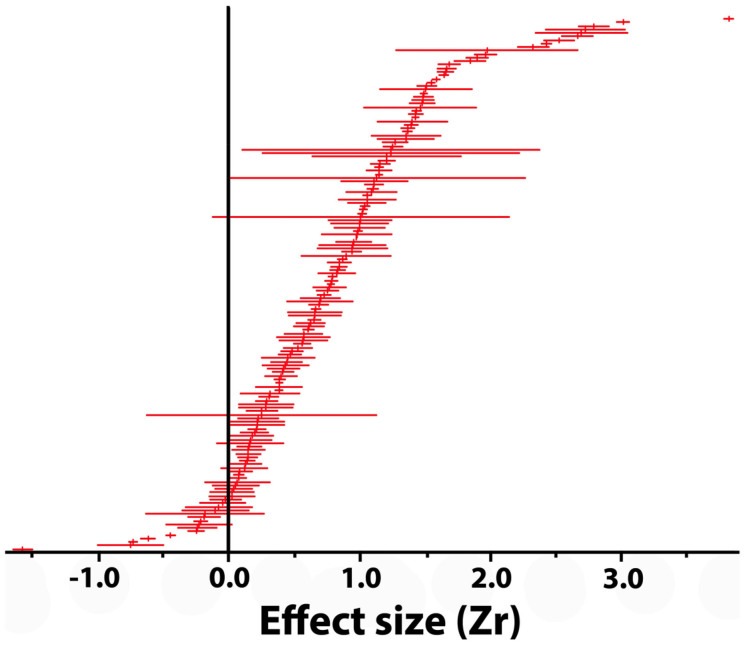
Figure 2. Plot of the 151 effect sizes of the relationship between mutation rates and radiation from Chernobyl, ordered by increasing effect.
Effect sizes are z-transformed Pearson product-moment correlation coefficient estimates, shown with the 95% confidence intervals. The vertical line represents an effect size of zero.

