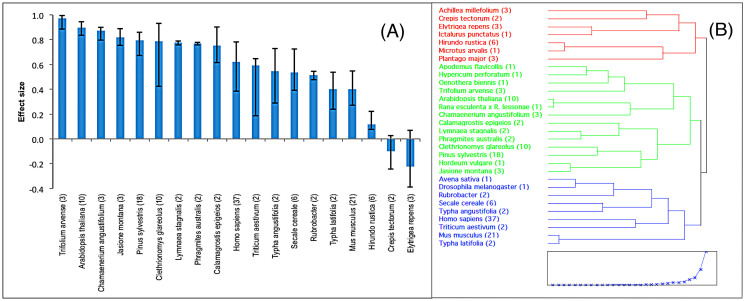
Figure 4. Species-specific effect sizes of radiation on mutation rates differ widely among taxa.
(a) Mean effect size of radiation on mutation rates for individual species, with bootstrap CI of the estimate (10,000 iterations). Number of data points available for each species is indicated next to the species name. (b) Dendrogram based on effect size similarity for all species included in the study, constructed using Ward's minimum variance method. Sample size for each species is shown in parentheses.

