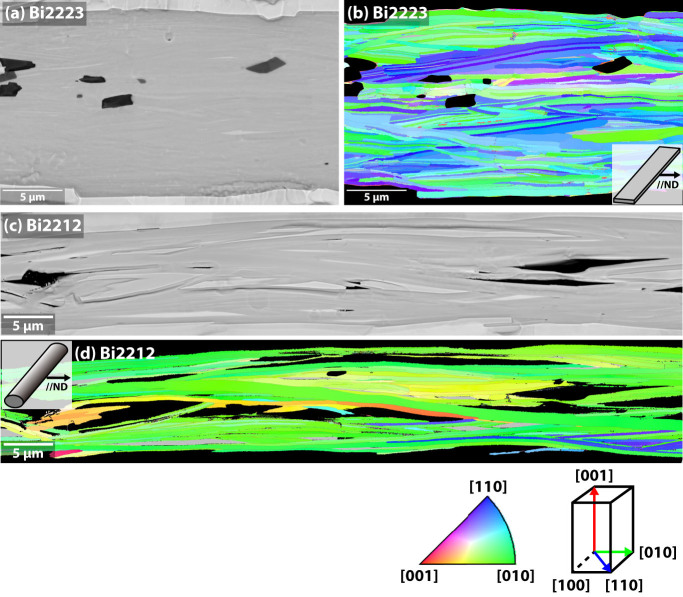
Figure 3. Comparison of the grain structure of Bi2223 and Bi2212 filaments as viewed along the ND parallel to the tape plane in Bi2223 and along an ab-plane-oriented section of a Bi2212 filament.
A longitudinal cross section of a representative area of Bi2223 is shown in (a) by a backscattered electron SEM image, and in (b) by a corresponding ND-IPF map, whereas those of Bi2212 are shown in (c) and (d). In the ND-IPF maps, Ag and second phase regions are blacked out and low Tc phase regions (Bi2212 in Bi2223 and Bi2201 in Bi2212) are colored gray (the outer black regions are the Ag sheath). Colors in (b) and (d) correspond to the grain orientations defined by the crystallographic directions parallel to the ND projection axis which is perpendicular to the wire direction.

