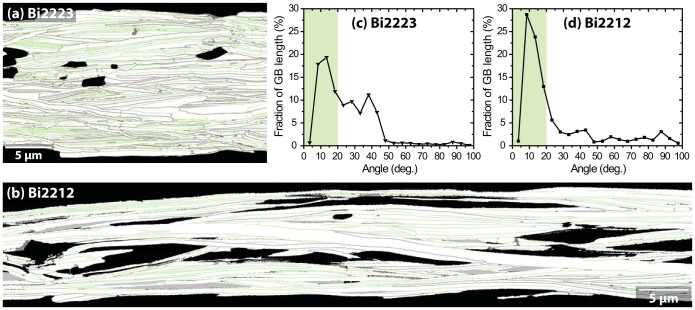
Figure 4.
(a) (b) GB maps of the areas of figure 3a (Bi2223) and 3c (Bi2212), respectively. GBs with misorientation angle of ≤20° are traced in green, while misorientations >20° are colored in dark brown. Based on these GB maps, the fractional GB length is plotted as a function of misorientation angle for (c) Bi2223 and (d) Bi2212. The shaded area represents the fraction of GBs having misorientations of ≤20° that appear green in (a) or (b). Note the large difference in the most frequent misorientation (~14° in Bi2223 versus ~8° in Bi2212) between the two conductors.

