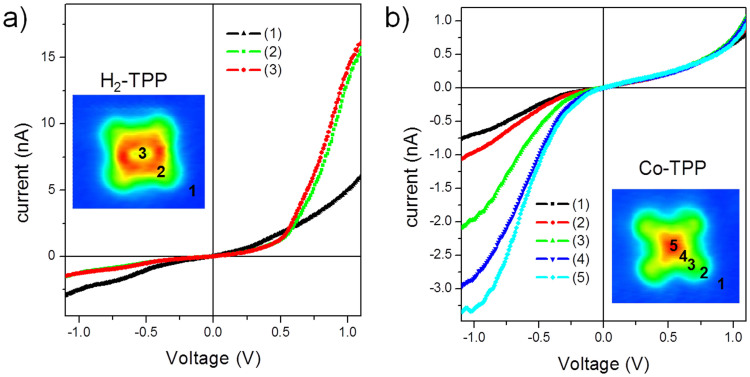
Figure 3. Current-voltage characteristic curves measured at different positions over the (a) H2-TPP and (b) Co-TPP molecules absorbed on Cu3Au (100) substrate.
The insets are STM images with the indication of the position were the curves were acquired. The STM topographic image were obtained at 0.30 V and 2.0 nA for both molecules. The I–V curves were obtained at a −0.55 V sample bias voltage and with a 2.0 nA set current for the H2-TPP, while for Co-TPP the parameters are −0.60 V and 0.3 nA.

