Figure 2.

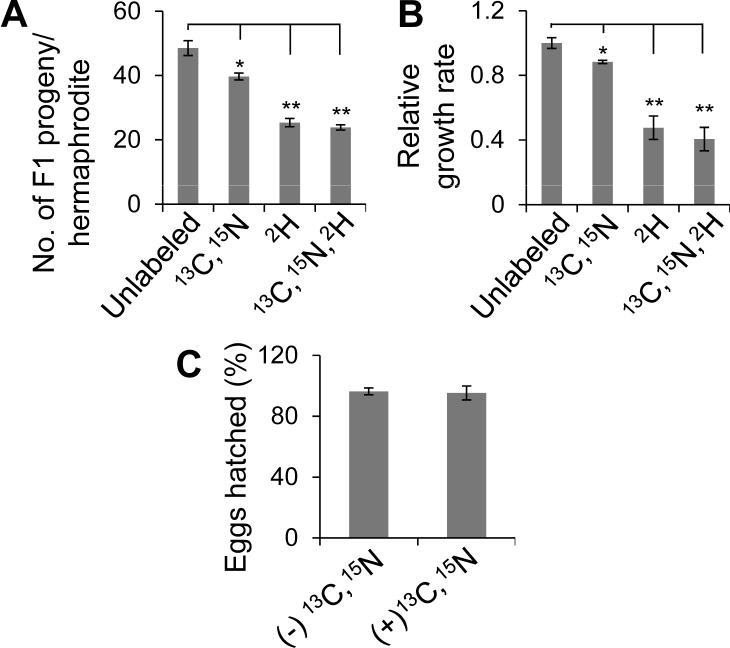
Effects of isotopic labeling on brood size (A), growth rate (B), and hatching (C) of the TG nematode line expressing (b)opsin in both neurons and muscles. A) To estimate brood size, the F1 progeny produced by singly (2H,~70%), doubly (13C,15N,~100%) or triply (2H,~80%; 13C,15N,~100%) isotopically labeled transgenic worms were counted. Data are from three independent experiments, n>20. Error bars indicate means ±SE. *P<0.05, **P<0.01. One-way ANOVA with Dunnett’s correction. B) To estimate growth rate of these worms, we quantified the time for a life cycle (from L1 to L1 of F1 progeny) of transgenic worms. The relative growth rate is the ratio of the life cycle of unlabeled worms over that of each variant. Data are from three independent experiments, n>20. Error bars indicate means ±SE. *P<0.05, **P<0.01. One-way ANOVA with Dunnett’s correction. C) Worms raised in 70% 2H containing S-medium laid eggs at similar hatching rates in 13C,15N (~100%) containing S-medium and control medium((−)13C,15N). Data are from three independent experiments. Error bars indicate means ±SE, n>60. Students t test.
