
Figure 2.
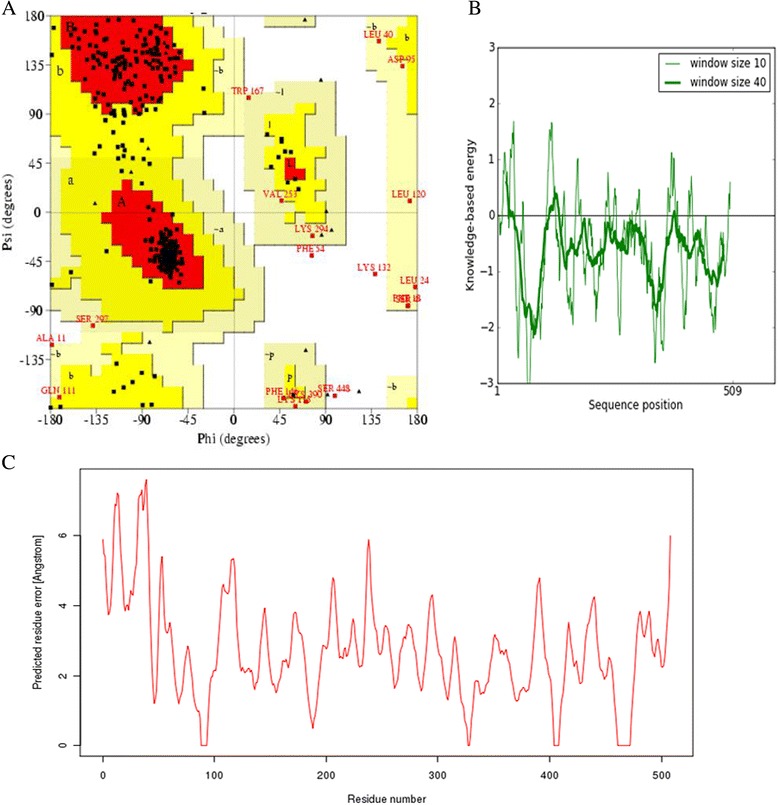
Structural Quality Assessment. (A) Ramachandran plot of orphan cytochrome P450 4X1 protein showing the distribution of residues in favored, allowed and outlier regions. (B) PROSA Z-score with respect to residue. (C) Q-Mean score.
Official websites use .gov
A
.gov website belongs to an official
government organization in the United States.
Secure .gov websites use HTTPS
A lock (
) or https:// means you've safely
connected to the .gov website. Share sensitive
information only on official, secure websites.
Structural Quality Assessment. (A) Ramachandran plot of orphan cytochrome P450 4X1 protein showing the distribution of residues in favored, allowed and outlier regions. (B) PROSA Z-score with respect to residue. (C) Q-Mean score.