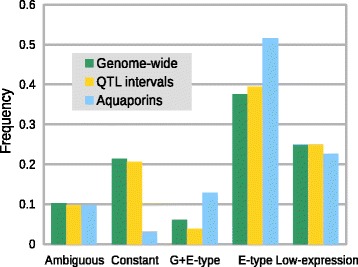
Figure 5.

Categorical distribution of genes across the genome (n = 34,178), within QTLs intervals previously identified (n = 755), and among aquaporins (n = 31). Untested genes are not included in frequency calculation. Because the number of Aquaporins is small, all categories that showed a genotypic and environmental response – GxE, G + E, and G + E-ambiguous - were combined (G + E-type), as were categories that had an environmental response but no or small genotypic effects (E-only + E-ambiguous = E-type).
