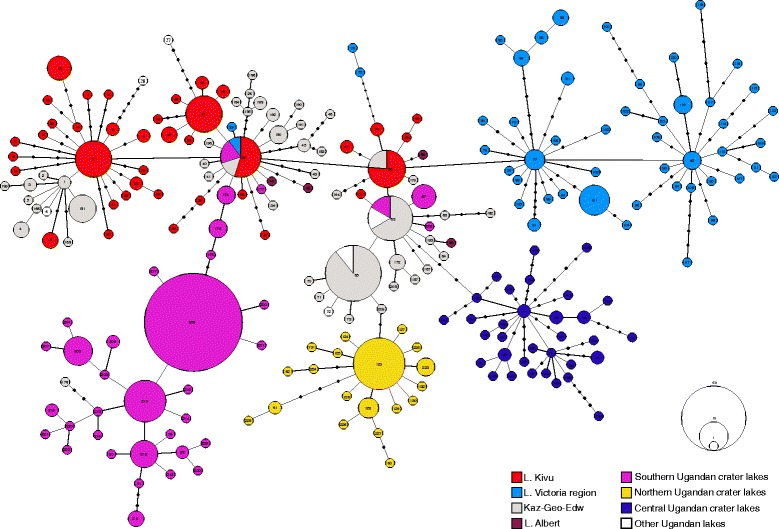
Figure 3.

Median-Joining network showing the relationships among haplotypes, defined by mitochondrial control region sequence variation. The size of the circles is proportional to the frequency of each haplotype. Haplotypes from Kivu, Victoria, source, northern, central and southern lakes are shown in red, light blue, gray, yellow, blue and purple, respectively.
