
Figure 1.
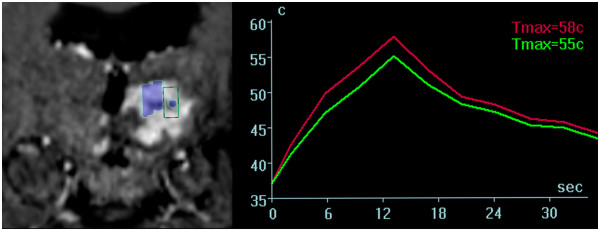
Coronal MR sequences of the tumor as depicted on the operator workstation. Console (left image). Blue marked areas correspond to completed sonication volumes; the area within the green frame illustrates the consecutively planed treatment target. Thermometric mapping (right image) shows a rapid drop of temperature within the tissue target after sonication.