Figure 3.
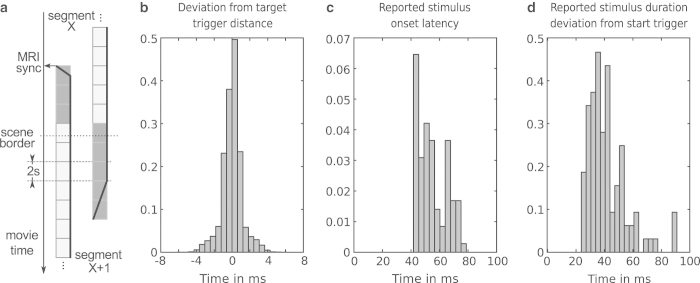
Stimulus synchronization and timing accuracy. (a) Schema for movie segment transitions and synchronization with the MRI scanner's volume acquisition trigger signal. The solid black line shows the relative stimulus volume at the beginning and end of a movie segment. (b) Histogram of inter-trigger pulse duration deviations from the target duration of 2 s – as recorded by the stimulus software. This is an estimate of the temporal uncertainty of the timing information. Trigger pulses are sent by the MRI scanner at precise intervals of 2 s at the start of each volume. (c) Histogram of movie onset latencies (deviation from the respective trigger pulse) as reported by the stimulus software. This is a worst-case estimate that includes all file access latencies and indicates the complete latency until the underlying movie presentation engine reports the start of a movie segment back to the stimulus software. (d) Histogram of deviations of movie segment duration from target duration. All histograms are normalized and aggregate information across all participants.

