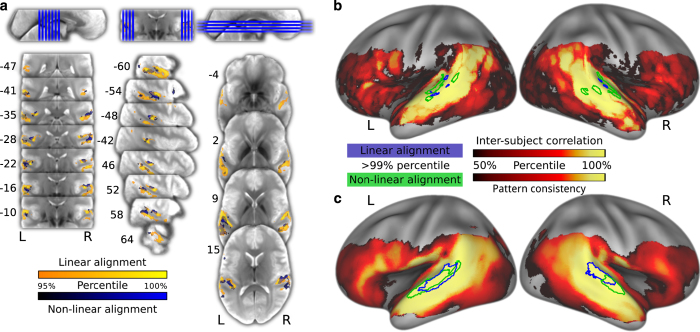
Figure 5.
Area of maximum inter-individual response similarity. (a) Representative slices of the group EPI template depicting the 95% percentile of univariate inter-brain time-series correlations for linear (blue) and non-linear (yellow) alignment in the group EPI template space. (b) Distribution of percent ranks of mean inter-brain correlations on the cortical surface. The statistical map is thresholded at percent rank=50%. The colored outlines depict the 99% percentile for linear (blue) and non-linear (green) alignment. (c) Analog to panel B, depicting the distribution of multivariate 2nd-order pattern consistency. Projection onto the surface was performed using Caret 5.64 with the PALS-B12 atlas40.

