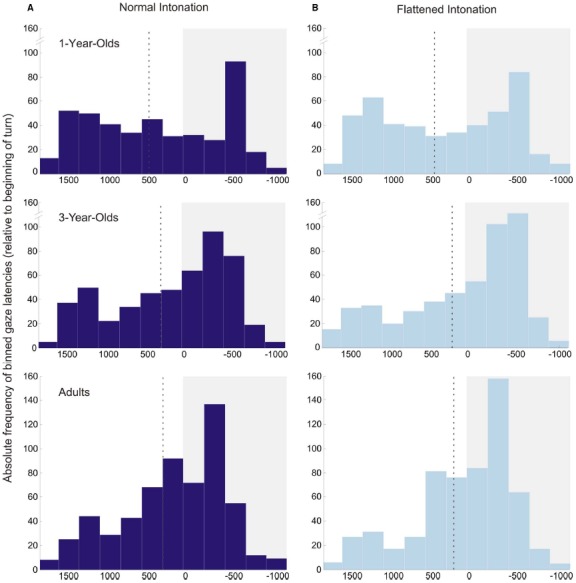
FIGURE 5.

Histograms of anticipatory and reactive gaze shifts in the normal (A) and flattened (B) condition for all age groups. Values during a time interval with a white background illustrate anticipatory gaze shifts; values during a time interval with a gray background illustrate reactive gaze shifts (zero indicates beginning of turn). The dotted line in each plot displays the average gaze latency in this age group/condition. Bin size is 250 ms.
