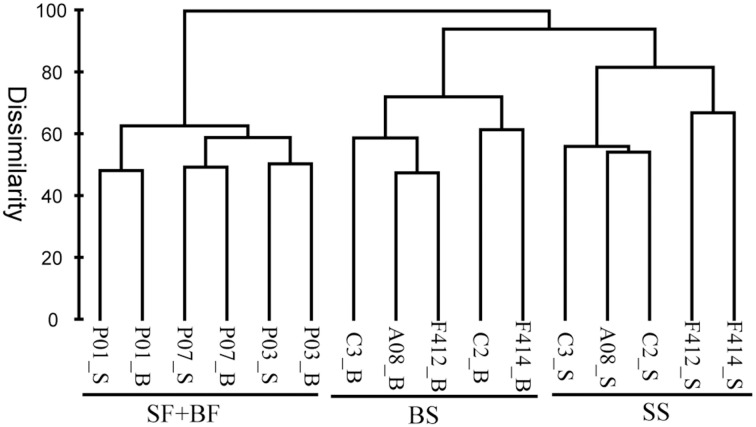
Figure 5.
Bray-Curtis dissimilarity based dendrogram showing the clustering of samples at the OTU level. The hierarchical clustering was calculated with average linkage algorithms using PRIMER 5. SF, freshwater surface; BF, freshwater bottom; SS, saltwater surface; BS, saltwater bottom. _S and _B standed for the surface and bottom water, respectively.

