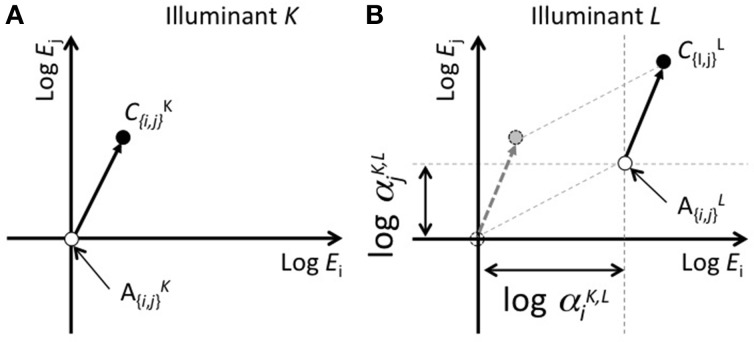
Figure 1.
Schematic of the concept of color-shift predictions from scaling cone responses in accordance with the achromatic point. (A,B) represent color appearance in cone response space under illuminants K and L, respectively. The vertical and horizontal axes represent logarithms of the responses for two cone classes. The scaling of the cone response is represented by a parallel shift in this plane. The difference between the achromatic points under two illuminant conditions (alphaK,L{i, j}, where i and j represent cone classes, and K and L represent illuminant differences) represents logarithms for the von-Kries coefficients.

