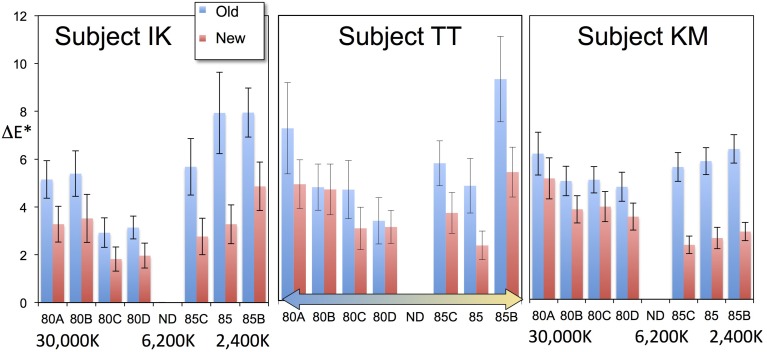
Figure 3.
Comparison of errors in our previous data (“Old”) against errors after optimizing for different lightness levels (“New”). Each bar represents the mean errors of 20 color chips, and the error bars represent the standard errors. The introduction of optimization for different lightness levels clearly improved the fitting. The two conditions show a statistically significant difference. See the text for further details.

