Figure 4.

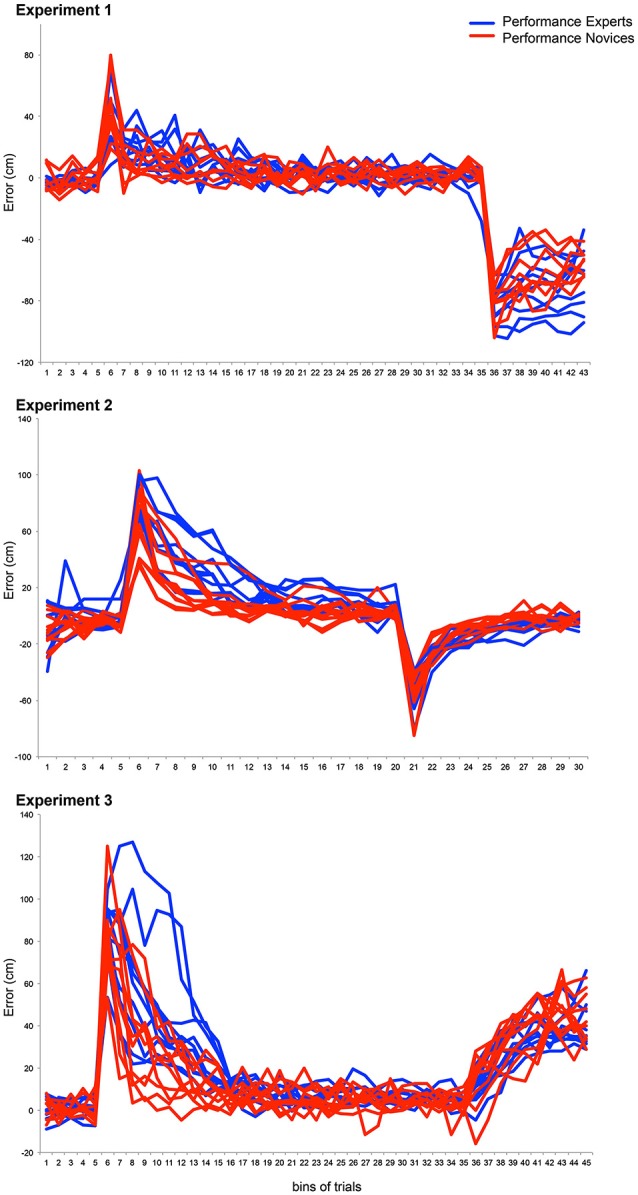
This graph shows single subject data from Experiments 1 to 3. The blue (Experts) and red lines (Novices) depict movement errors of bins of trials (i.e., the average of 10 subsequent trials) made by the subjects.

This graph shows single subject data from Experiments 1 to 3. The blue (Experts) and red lines (Novices) depict movement errors of bins of trials (i.e., the average of 10 subsequent trials) made by the subjects.